
Active level
Objective, pre‑defined levels with standardized risk.
- Session aware
- Instrument specific
- Clear invalidation
ANALYSIS-DRIVEN MARKET PREPARATION
ChartThread filters the market, reveals structural context around zones of interest and active market phases, and standardizes risk — without signals or predictions.
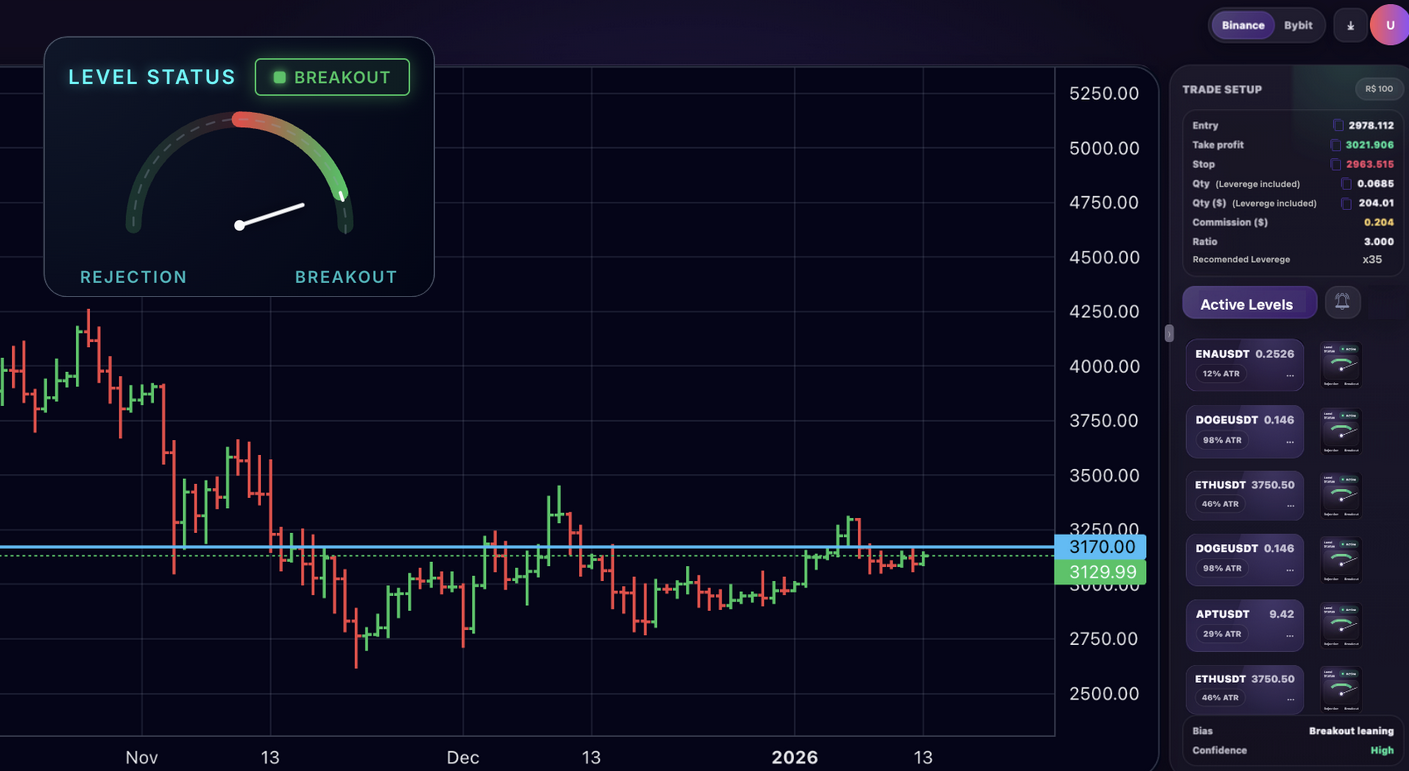
Structural bias and reaction statistics for today’s key levels.
Objective, pre‑defined levels with standardized risk.

Objective, pre‑calculated futures spread where net divergence exceeds normal market conditions.

Objective, automatically detected fair value gap where price moved with imbalance, leaving an unfilled zone of inefficiency.

Objectively identified key price level formed by repeated reactions and structural significance.
Structural context around key price levels so you can stop guessing and start executing a repeatable playbook.
Levels are generated from historical market structure and session behavior — not from signals, indicators, or subjective interpretation.
Before price breaks or falsely breaks a level, the chart leaves a behavioral footprint. ChartThread analyzes this behavior to build prerequisites that indicate the likelihood of a reaction.
The system continuously reads every price movement in real time, analyzes it, and classifies it across predefined reaction prerequisites.
ChartThread takes over market monitoring and setup discovery, surfacing a focused shortlist of the most active setups where price is currently in a zone of interest.
A three‑step preparation workflow that fits inside your existing process.
Start your day by reviewing selected setups where price is approaching an area of interest and preparing for a potential move. Add only the instruments where the market context is clear and aligns with your trading logic.
Analyze how price has historically reacted at the level and what “normal” behavior looks like for this setup. Capture your expectations and observations directly next to the setup to build personal statistics and improve decision-making.
Calculate position size, define risk, and lock in your plan before price reaches the level. Make sure the trade fits within your risk limits and respects your execution rules.
Most trading mistakes happen before the trade is executed. ChartThread standardizes preparation so your decisions are deliberate, not reactive.
ChartThread is not for everyone — and that’s intentional.
Level reaction bias is only the entry point. ChartThread is the system around it.
Build a consistent, repeatable daily prep routine anchored around objective levels and structural context.
Translate prep into executable plans with predefined risk, targets, and invalidation — before price gets there.
Review trades in the exact context they were planned, not just as filled orders on a blotter.
Share levels, scenarios, and playbooks with your desk or community to keep everyone aligned.
See risk exposure across instruments, sessions, and setups in a single view.
Connect ChartThread to your execution platform and analytics stack to complete the loop.
Simple, transparent pricing as we roll out early access.
Free
$12 /month
$19 /month