
A level is a number, not a zone
A horizontal level is a precise price at which the market has repeatedly shown that supply and demand flip — where selling reliably overwhelms buying, or the reverse. Not a shaded rectangle, not “the 720–735 area,” not a band of two moving averages. A number.
This is the core discipline of the school we build on — the school of a trader once called one of the safest on Wall Street. In that methodology, a level is drawn at the exact extreme of the candle that formed it: the exact high, the exact low. If you cannot name the price, you do not have a level — you have a mood.
Why does precision matter beyond aesthetics? Because everything you do with a level downstream — judging whether it held or broke, measuring the quality of a retest, keeping honest statistics on your own preparation — depends on the level being falsifiable. A zone can absorb any outcome and claim credit. A number can be wrong. That’s what makes it useful.
What that looks like on a chart
On May 23, BNB printed a high and reversed. The market then spent almost three months doing something entirely different — a 25% drawdown, a long grind sideways, a recovery. In late August, price came back to that same area. It stopped at 728.60. Twice. To the tick.
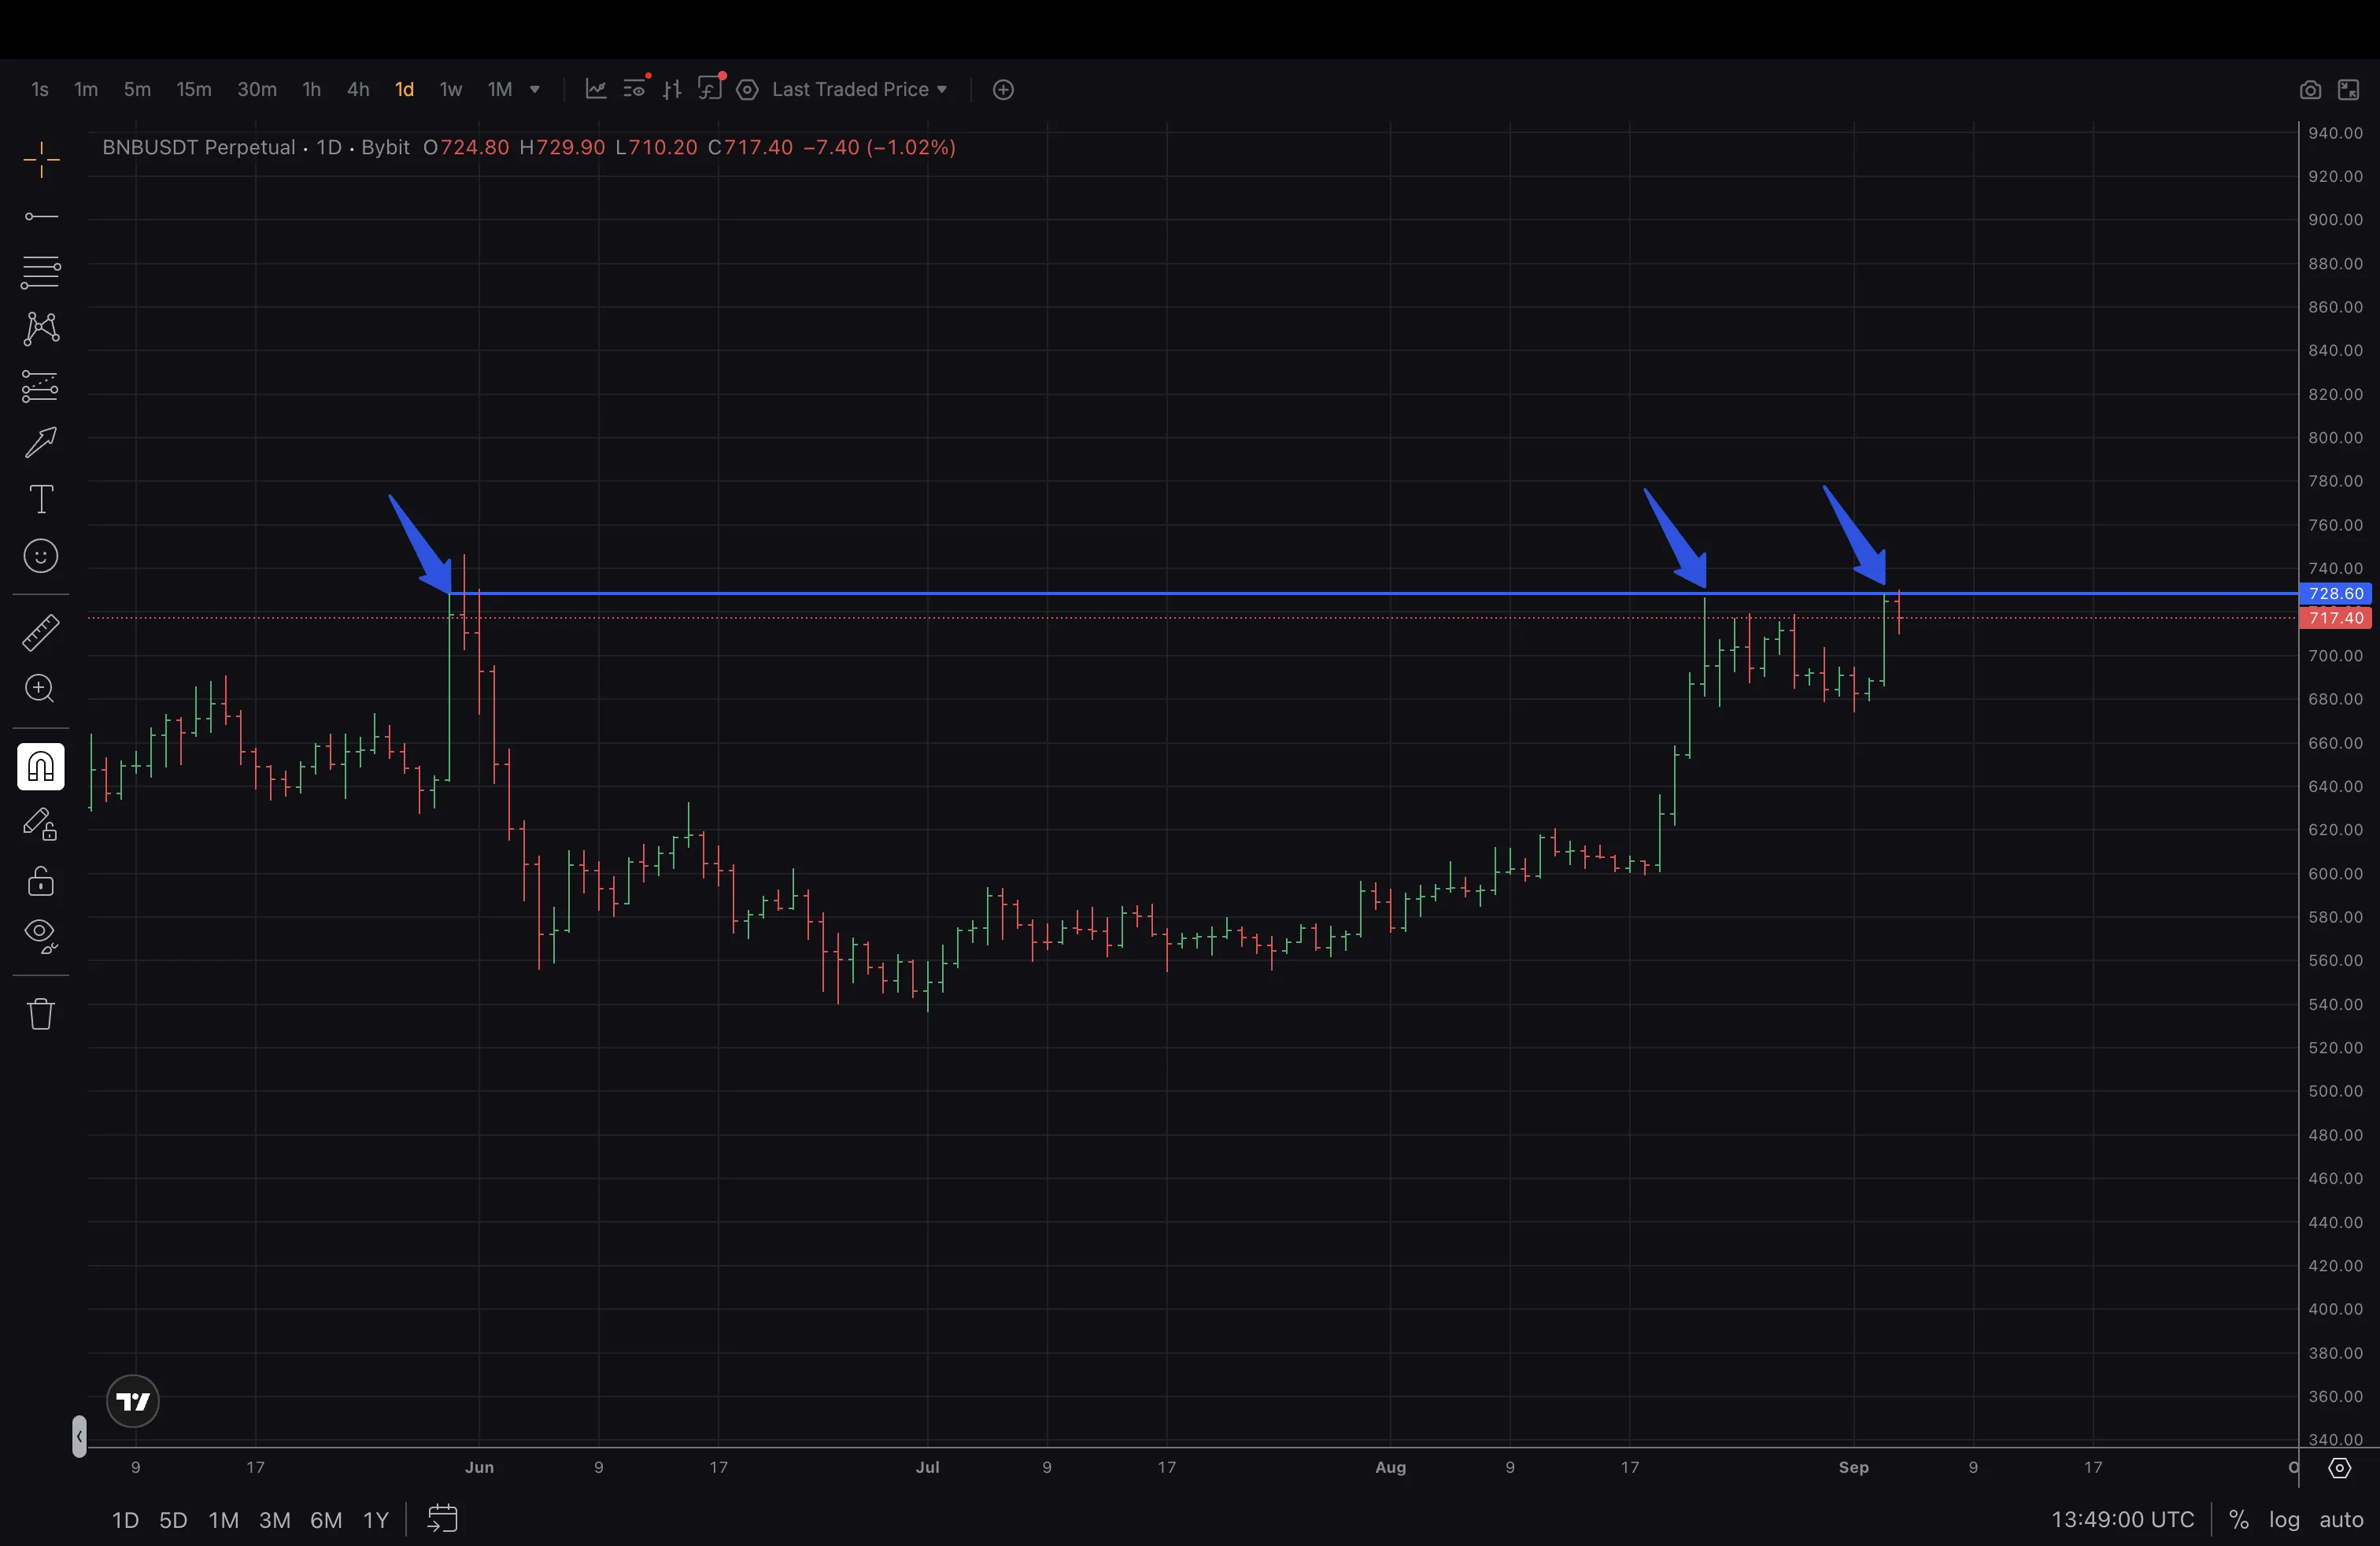
Nothing on the chart “knew” that number. No indicator was pointing at it. Price didn’t stop “around 730” — it stopped at the precise high from May, twice, months later. A zone would have told you nothing actionable; the number told you exactly where the market’s memory lives.
The same mechanics work on the support side, and well beyond the majors. On JUP, the level is 0.20150 — the exact price where the rejections happened — and the two arrows mark consecutive daily wicks that tagged it to the tick and reversed.
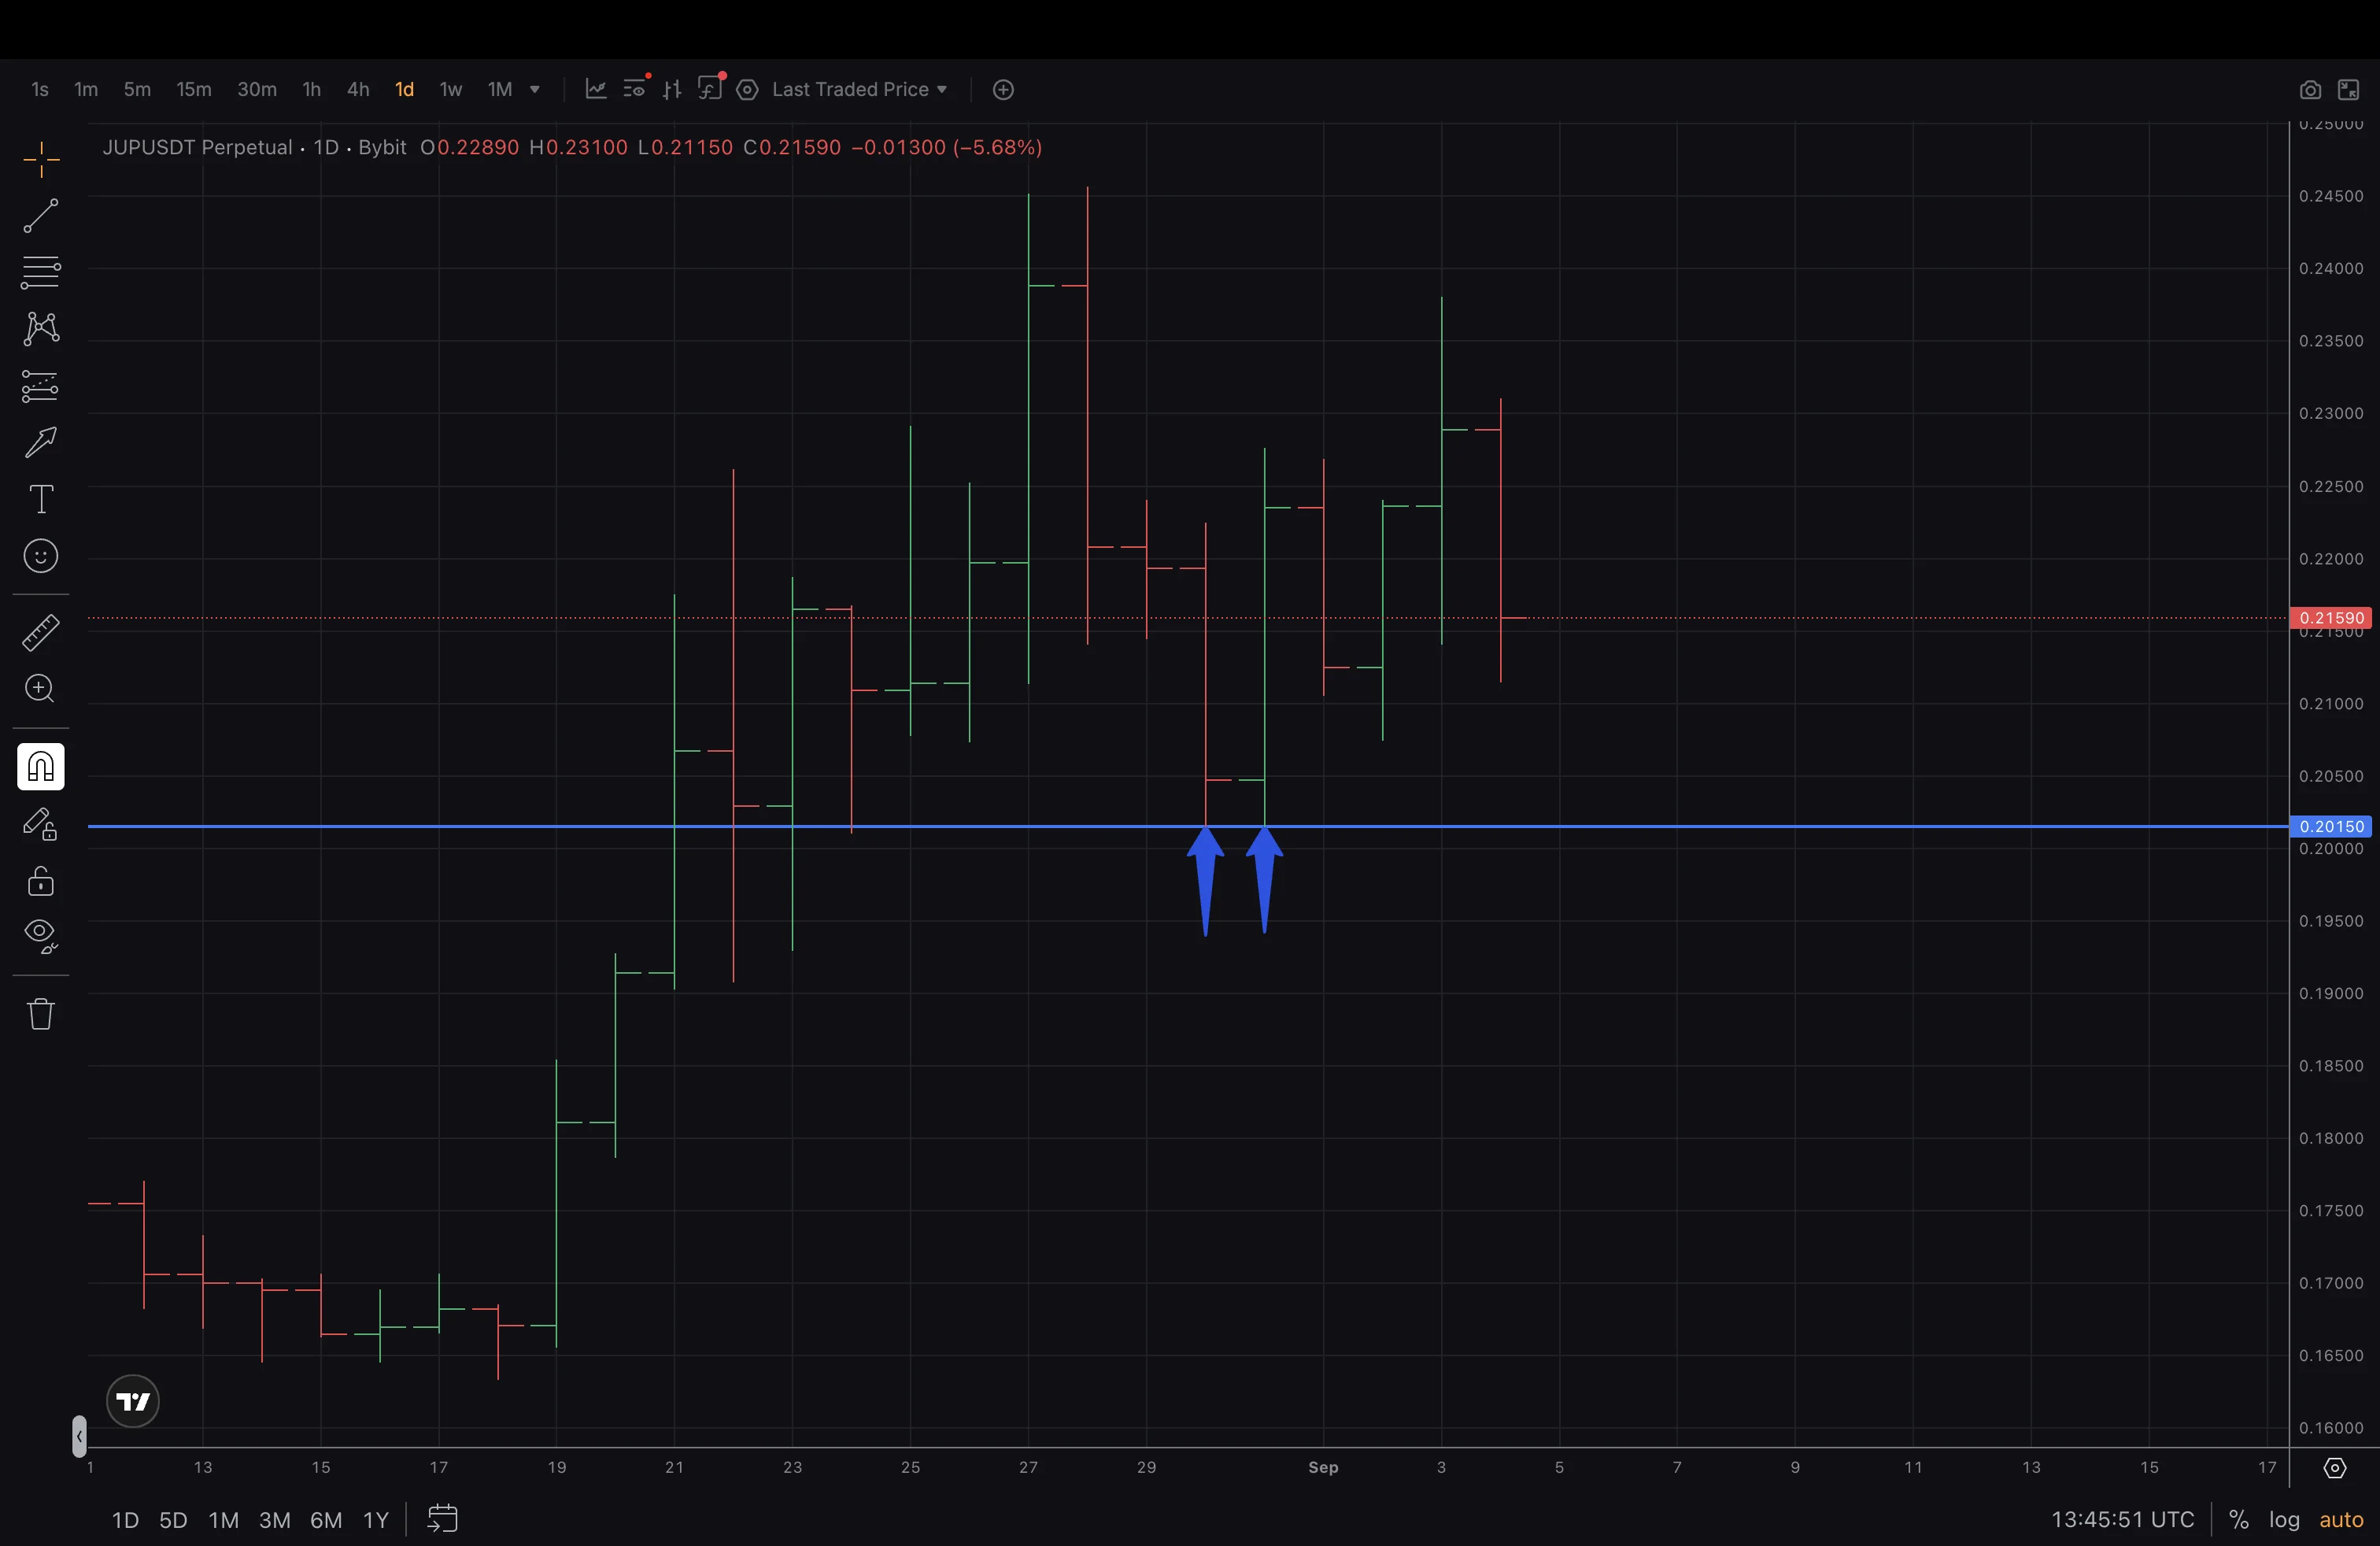
Two different instruments, two different sides of the market, one principle: the market remembers exact prices. The rest of this post is about why that happens and how to find these numbers before price returns to them.
Why levels work
Levels are not chart magic. They work because markets are auctions, and auctions have participants whose size forces them to behave in visible, repeating ways.
Large limit orders live at specific prices. A participant who needs to buy or sell serious size cannot do it with market orders — they’d move price against themselves. They work limit orders at a price they’ve chosen. When price reaches that price, the orders absorb the flow and price rejects. The long wicks you see at a level are the footprint of that absorption: price went there and was thrown back. If the interest at that price wasn’t fully filled, the orders — or the intent behind them — are often still there on the next visit. That is why a level formed in May can still act in September: it isn’t the chart remembering, it’s a participant who didn’t finish their business.
Everyone else organizes around the same reference. Stops cluster just beyond an obvious extreme. Breakout traders queue on one side, mean-reversion traders on the other. The level becomes a self-reinforcing coordination point — the price where the maximum number of decisions concentrate, which is exactly why reactions there are sharp rather than mushy.
False breakouts strengthen the case rather than break it. Look again at how the BNB level was born: the May candle actually pierced above the prior structure before closing back below and collapsing. That pierce-and-reject is a false breakout — price went beyond the extreme, found no real buying, ran the stops sitting there, and reversed. A false breakout is some participant’s proof that the other side of that price is empty. It’s one of the strongest ways a level can form, because the market has tested what’s beyond and got its answer.
None of this guarantees the next touch holds. Levels shift the distribution of outcomes; they don’t script them. But “price is far more likely to react at 728.60 than at 731” is real, tradable information — and it’s information you can verify, touch by touch, precisely because the level is a number.
How to identify a level properly
The process is mechanical enough to be described, which also means it’s mechanical enough to be done badly. The rules that matter:
Work from the daily timeframe first. Daily extremes are where the largest participants leave footprints. Intraday levels exist, but they are children of the daily structure, not substitutes for it. If your preparation starts on the 15-minute chart, you’re mapping noise.
Draw at the exact extreme. The level is the precise high or low of the candle that formed it — not a rounded number nearby, not the candle body, not an average of several highs. 728.60 and 0.20150 are levels; “about 730” and “the 0.20 handle” are not.
Demand confirmation through touches. One extreme is a candidate. What promotes it to a level is the market returning and respecting the same price — the more touches, and the more precise the touches, the more real the interest at that price. Precision of the touch matters as much as the count: three rejections within a hair of the number outweigh five vague turns in its vicinity.
Read the tails. Long wicks into a level and sharp closes away from it are absorption made visible. A level that price drifts through lazily and a level that throws price back violently are not the same object, even if both are horizontal lines.
Judge tolerance relative to volatility, not in fixed ticks. “Price touched the level” means something different on an instrument with a $2 daily range than on one with a $40 range. The honest way to define a touch is as a fraction of the instrument’s normal daily range — so the same rule scales across BNB, JUP, and everything else you screen.
Respect age, and respect abnormal candles. A level that has held for months, like the BNB high, carries more information than one formed last week. And extremes printed inside panic candles — the kind several times larger than a normal day — need separate treatment: the price discovery inside them is chaotic, and levels born there behave differently.
The common failure mode is the opposite of all this: fat hand-drawn zones, redrawn every morning to fit yesterday’s action, anchored to round numbers because they look important. That isn’t level analysis; it’s decoration. If your levels can’t be written down as exact numbers before the session and scored afterward — held or broke — you have no way to know whether your preparation is worth anything.
Where ChartThread comes in
Everything above is what a disciplined trader does by hand every morning — across however many instruments they can stand to screen before the session starts. It’s honest work, and it doesn’t scale.
ChartThread runs this process across every liquid instrument on Binance and Bybit, futures and spot, and outputs each level exactly the way this post defines one: a precise number with its evidence attached — how it formed, how many times it was touched and how precisely, the tails, the false breakouts, how long it has held. The 728.60s and 0.20150s, found before price gets there, not annotated after.
What it never outputs is advice. No signals, no entries, no targets, no scores telling you what to trade. The platform’s job is the preparation — the map of numbers the market remembers. Reading the conjuncture around them, and every trading decision that follows, is yours.