Energy · Lesson 11 of 12
V-shaped moves: why a fast move into a level fails
There’s a shape on charts that seduces almost everyone at first: price falls like a rock, then rockets straight back up in a perfect V. It feels powerful — almost heroic, as if the market is reclaiming what was unfairly taken. Here’s the trap: V-shapes rarely break levels.
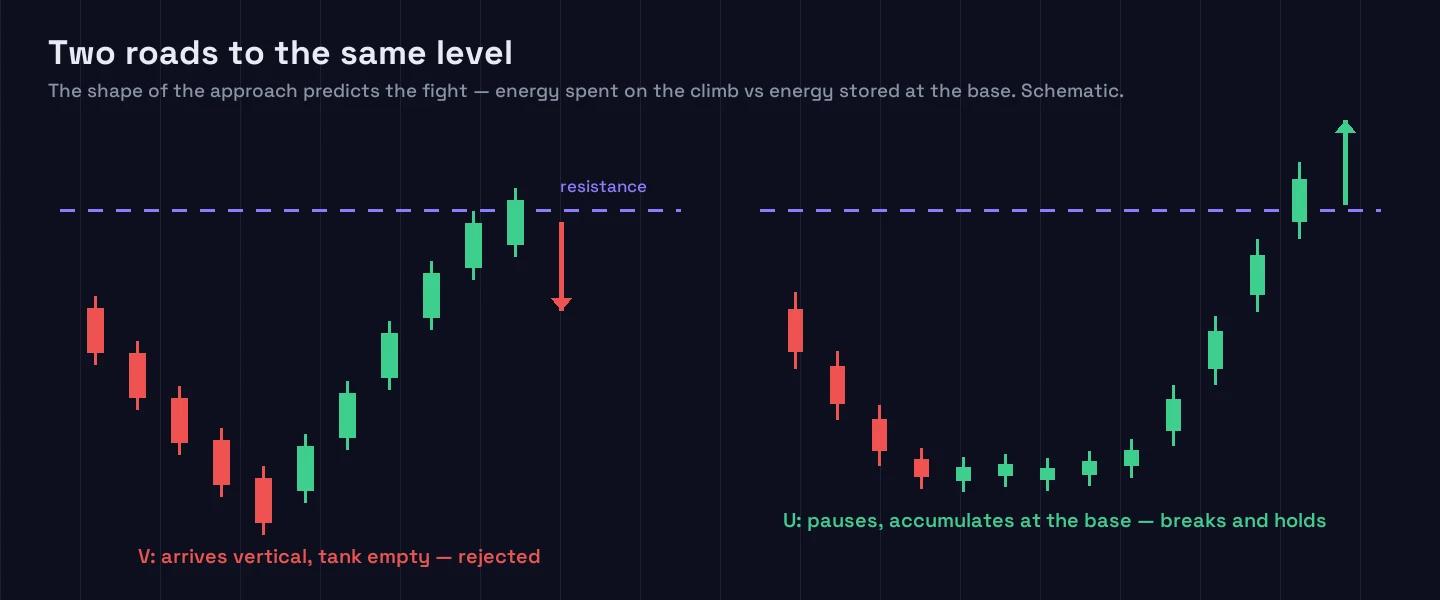
Why the V burns out
The reasoning is the energy logic that runs through this whole series. A strong level is defended with real orders, and breaking it requires stored fuel. A V-shaped move spends that fuel on the journey. Price doesn’t stop to breathe, doesn’t gather reinforcements, doesn’t build any base beneath itself — every candle of the rally is energy leaving the tank. By the time it reaches the level, the move is already exhausted.
What looks like strength is weakness in disguise. And the aftermath is predictable: the wall holds, the trapped chasers unwind, and the chart prints the anatomy of a false breakout.
What the U-shape does differently
The U is the V’s unglamorous sibling, and the difference decides everything. A U-shaped approach spends time at the bottom: bars shrink, volatility dies, price grinds sideways while orders quietly accumulate. It’s slow and frustrating to watch — you start wondering whether the market fell asleep.
That boredom is exactly the signal. The U is the market loading a spring, building the support beneath itself that the V never has. When a U-shaped base finally pushes through the level, there is fuel behind the move and a floor underneath it — which is why those breaks tend to stick, while V-breaks bounce.
The shape is information
The practical lesson isn’t a trading rule, it’s a reading habit: the shape of an approach tells you what to expect at the level before anything happens there.
- A vertical sprint into resistance → expect rejection or a short-lived fake. The energy is visibly spent.
- A slow grind that hugs the level → expect a real contest, and quite possibly a break. The energy is visibly stored.
This is the same information the breakout checklist reads through its five signals, compressed into a single glance at geometry. In my own watching, the vertical approaches fail or fake far more often than not — roughly nine times out of ten, the V gives the level nothing to worry about.
One caveat worth carrying from a later lesson in this series: shape alone is local information. A V-move against a strong long-term trend behaves differently from a V-move with it — more on that alignment in Friday’s article.
Don’t confuse speed with power. In markets, slow pressure is what bends steel.
Reading the shape of every approach, on every chart, without blinking — that’s the part ChartThread automates.
Educational content, not financial advice. Trading carries a risk of loss.