
Something brutal about markets that this week’s articles have been circling: breakouts don’t fail because levels are strong. They fail because price runs out of fuel.
Think of it as sprinting up a hill. If you burn everything just reaching the top, you have nothing left to stay there. That, in one image, is the anatomy of a false breakout.
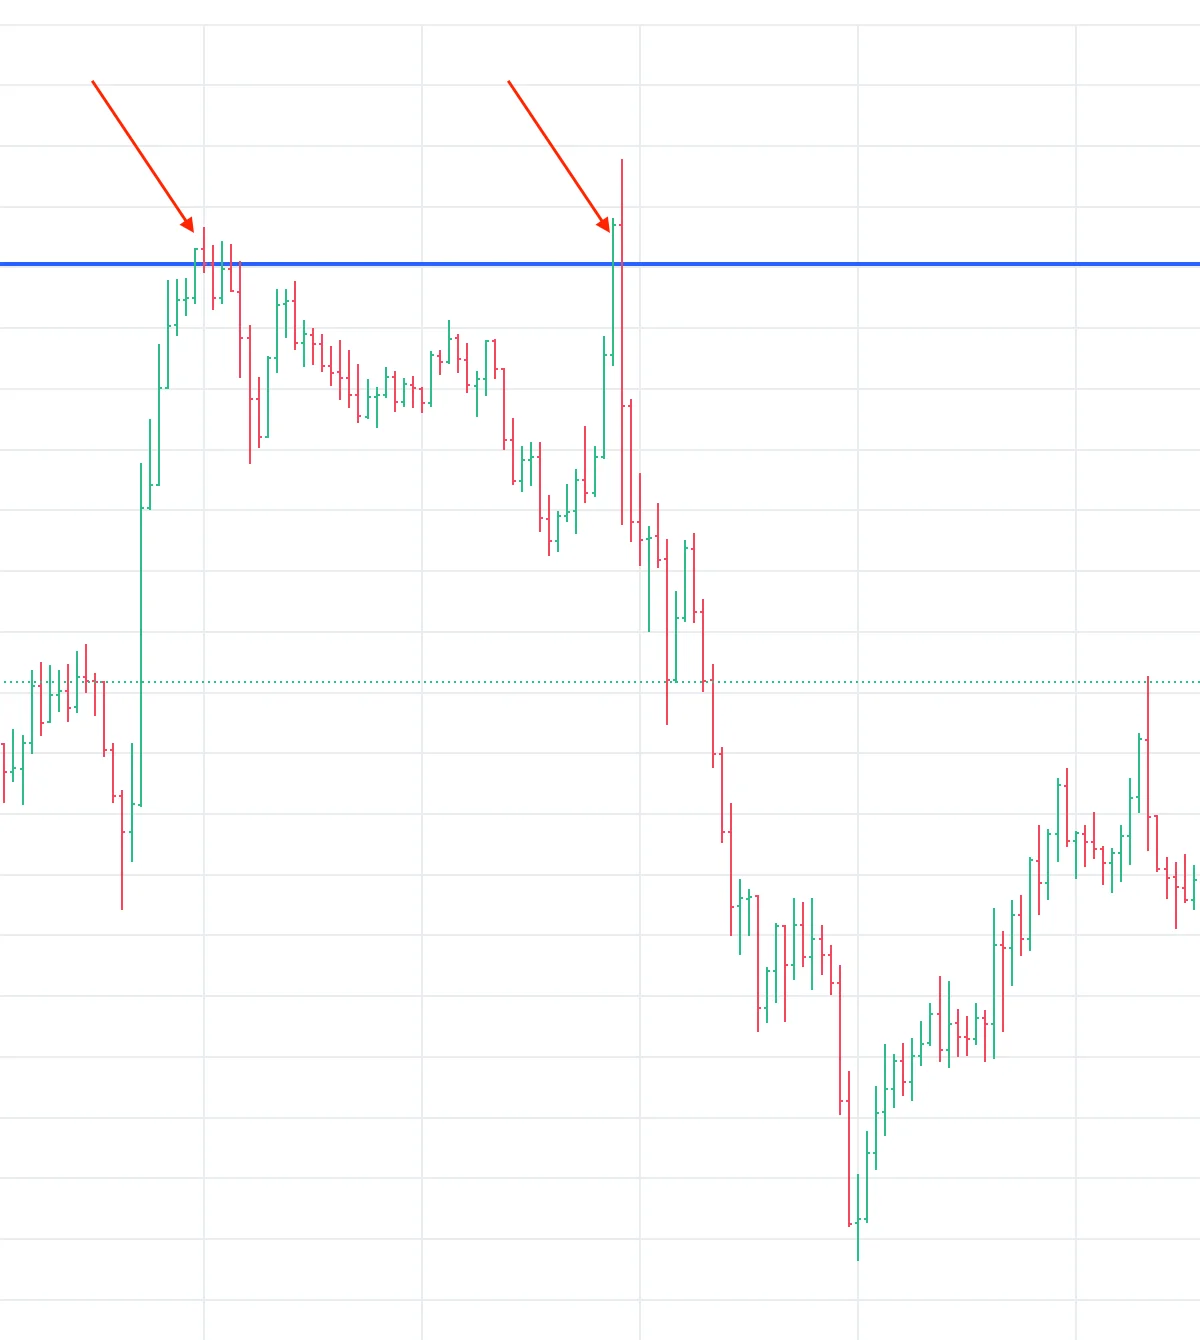
The engine and its absence
A real breakout runs on accumulation — the sideways range, the shrinking candles, the boring part where energy coils near the level. When price instead rushes straight at a level, eating 70–100% of its average daily range just to touch it, the engine is already empty. Every oversized candle on the approach is fuel already burned. By the time price taps the level, there is nothing underneath.
That is why false breakouts look so convincing at first. The candle that slices through resistance is genuinely violent — it’s the last of the energy being spent. Violence on the way in is not strength. It’s the bill coming due.
The trap, mechanically
What actually happens behind that chart, step by step:
- Buyers exhaust themselves pushing through the level.
- Sellers are waiting above it — that’s what a defended level is — ready to unload into the breakout.
- With no accumulation below to absorb the selling, price collapses back through the level.
- Everyone who bought the “breakout” is now trapped. Their stop-losses and liquidations become the fuel for the move in the opposite direction.
Note the grim symmetry of step 4: the failed breakout doesn’t just fizzle, it powers the reversal. This is why so many significant moves begin or end with a false break — it’s the final shakeout that flips direction, converting one side’s forced exits into the other side’s momentum.
Three red flags before the trap springs
None of this needs hindsight. The warning signs are on the chart before the break happens:
- Approach speed. Price rocketing into the level on oversized bars. The faster the approach, the emptier the tank.
- Range already spent. If 70% or more of the day’s typical range is gone before the level is even reached, the odds of a real break are terrible.
- No base nearby. No accumulation zone under the breakout point means nothing can support price on the far side. Whatever breaks, doesn’t hold.
Any one of these is a caution. All three together are close to a verdict — and they’re the exact inverse of the checklist from Tuesday.
Two camps, one mechanism
Traders split on this subject. Some love catching the failures and call themselves contrarians; others swear by momentum and chase every break. Both are right sometimes — but neither preference changes the mechanics. A breakout without energy behind it does not survive. That isn’t an opinion about style. It’s how the machine works.
Tomorrow, the last piece of this week’s series looks at the trap from the other side: when the false breakout itself becomes the most informative event on the chart.
Levels, and the state price arrives at them in, are what ChartThread tracks around the clock — including the approaches that look glorious and carry nothing.