The four pillars of a trade · Lesson 3 of 6
Pillar two, energy: can price get there, and beyond?
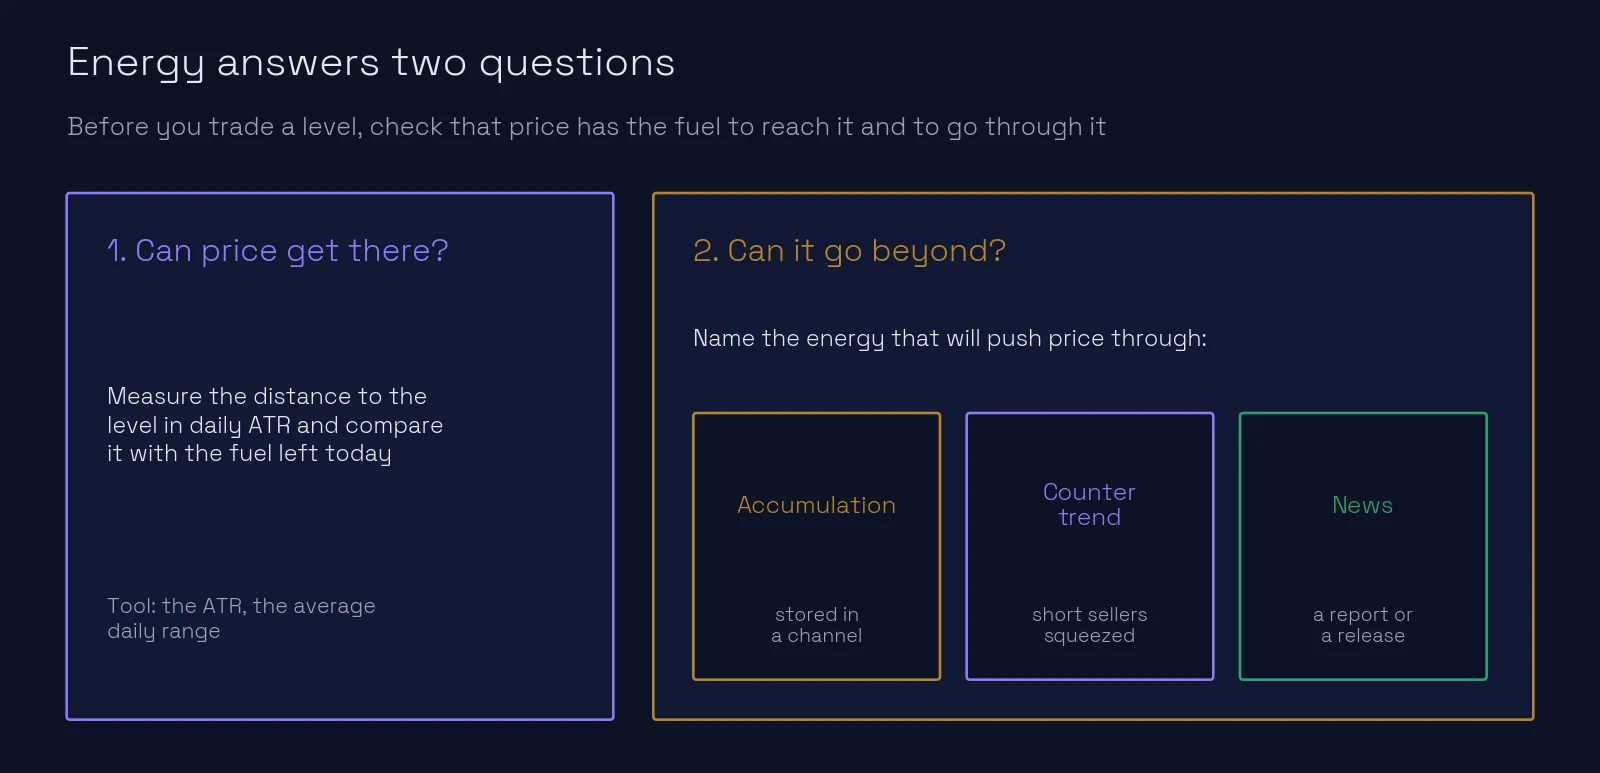
The level tells you where the trade happens. Energy tells you whether price can actually get there, and whether it has the power to go beyond. A level with no energy behind it is only a line on the chart.
What you’ll learn
- How to check with the ATR whether price can reach a level today.
- The three kinds of energy that carry price beyond a level: accumulation, counter trend and news.
- How each one looks on a real chart, and how strong the move after it was.
- Why a trade with no energy behind it is not a trade.
Question 1: can price get there today?
Every instrument has a normal daily range: the ATR, the average distance between the high and the low of a day. Think of it as the day’s fuel. When the fuel is spent, price rarely goes much further that day.
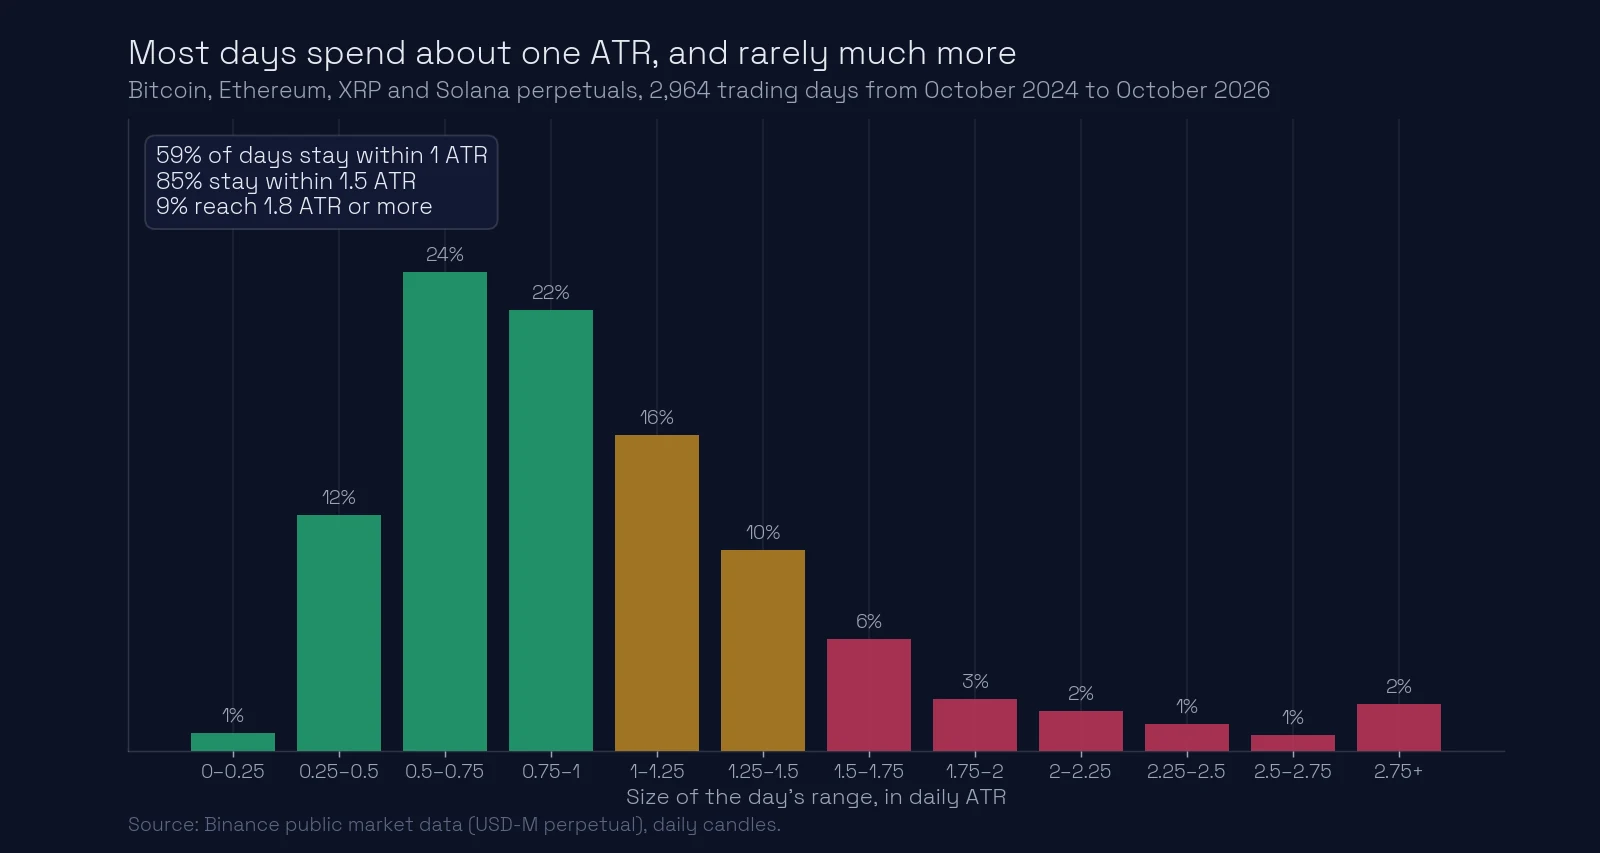
We measured 2,964 trading days of Bitcoin, Ethereum, XRP and Solana from October 2024 to October 2026. On 59% of days, the whole range of the day stayed within one ATR. On 85% of days it stayed within 1.5 ATR. Only 9% of days reached 1.8 ATR or more: those are the abnormal candles.
So the check is simple. Measure how much of today’s ATR price has already used, and how far the level still is:
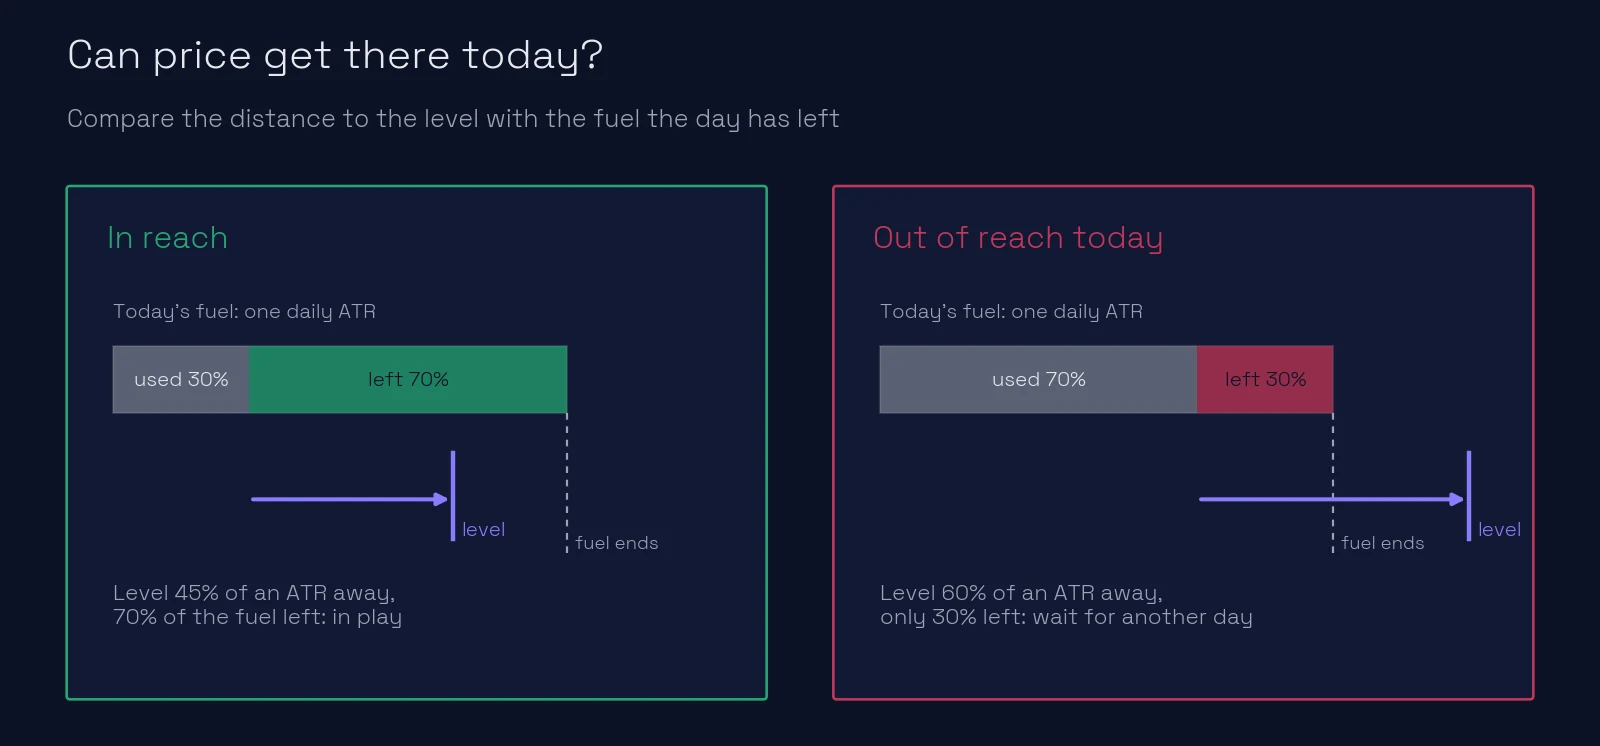
- The level is closer than the fuel left: it is in play today.
- The level is further than the fuel left: price will most likely not reach it today. Wait for another day instead of forcing the trade.
More on reading the fuel gauge in out of fuel.
Question 2: can it go beyond?
Reaching the level is half of the story. To break through it, or to bounce from it far enough to pay, price needs a push. In this course there are three kinds of energy that give it.
1. Accumulation: energy stored in a channel
Price moves sideways in a channel while a big player builds a position. The longer and the more precise the channel, the more energy is stored. When price leaves it, that energy carries price beyond the edge.
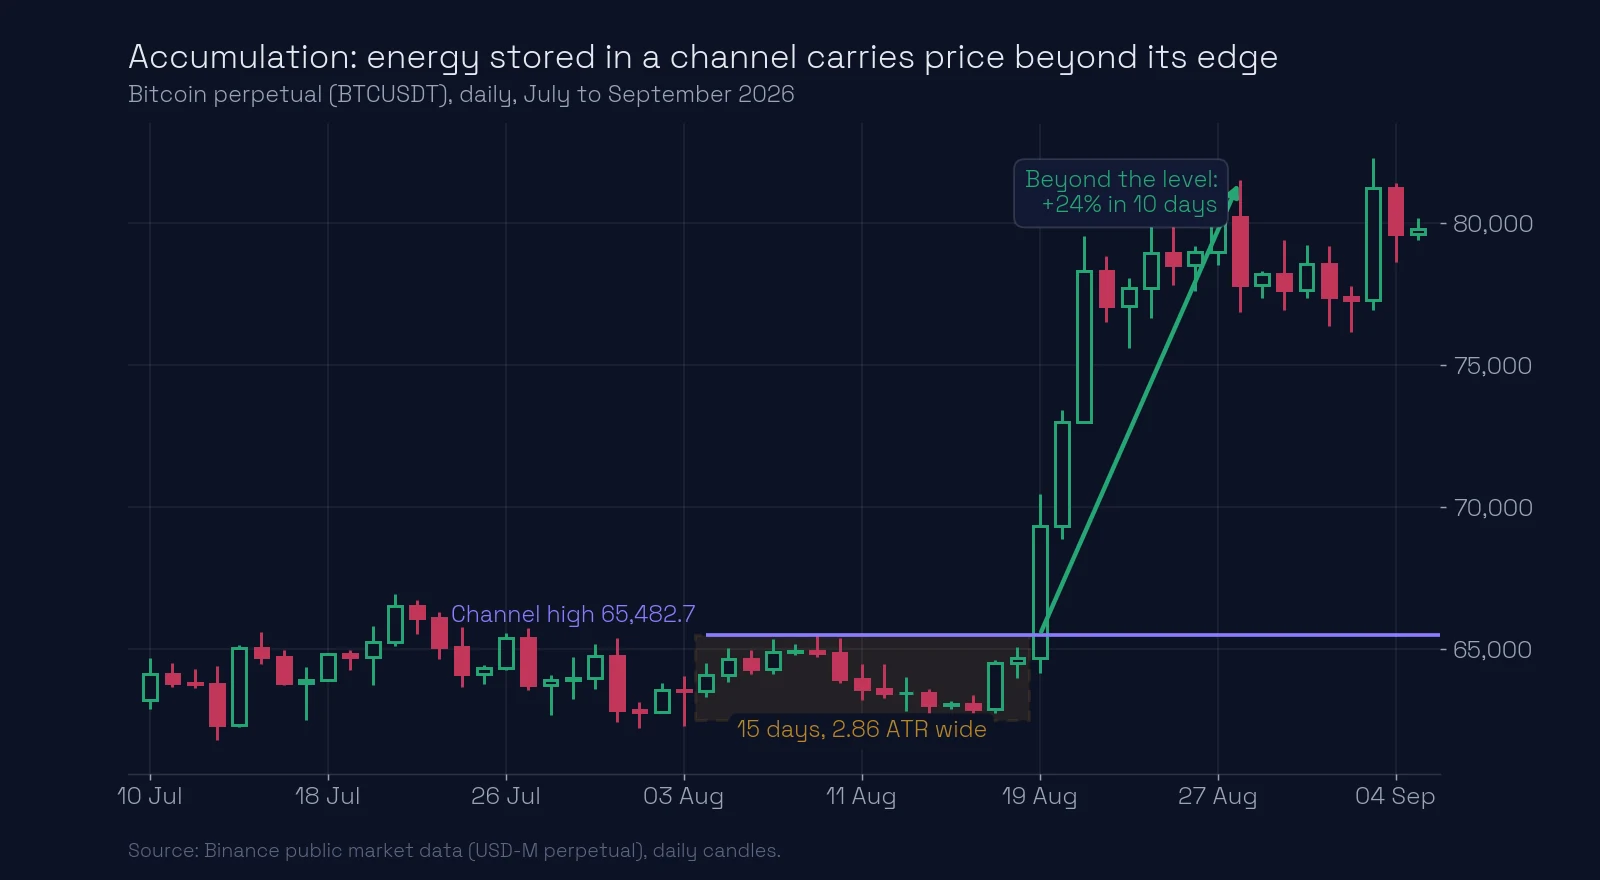
From 4 to 18 August 2026, Bitcoin traded between 62,484.2 and 65,482.7: 15 days, 2.86 ATR wide. That is a small accumulation: more than 14 days and narrower than 3 ATR. On 19 August price closed above the channel high, and by 28 August it reached 81,500, 24% above the edge of the channel. A small accumulation exits fast, exactly as the rule from the four pillars says.
The more accumulation there was, the more power price has to go further. More in accumulation or distribution.
2. Counter trend: a long fall, then the short sellers run
A long fall, then a pause, then a sharp jump up. During the fall, more and more traders sell short. When the fall stops and price goes sideways, the first strong move up forces them to buy back, and their buying pushes price higher still: a short squeeze.
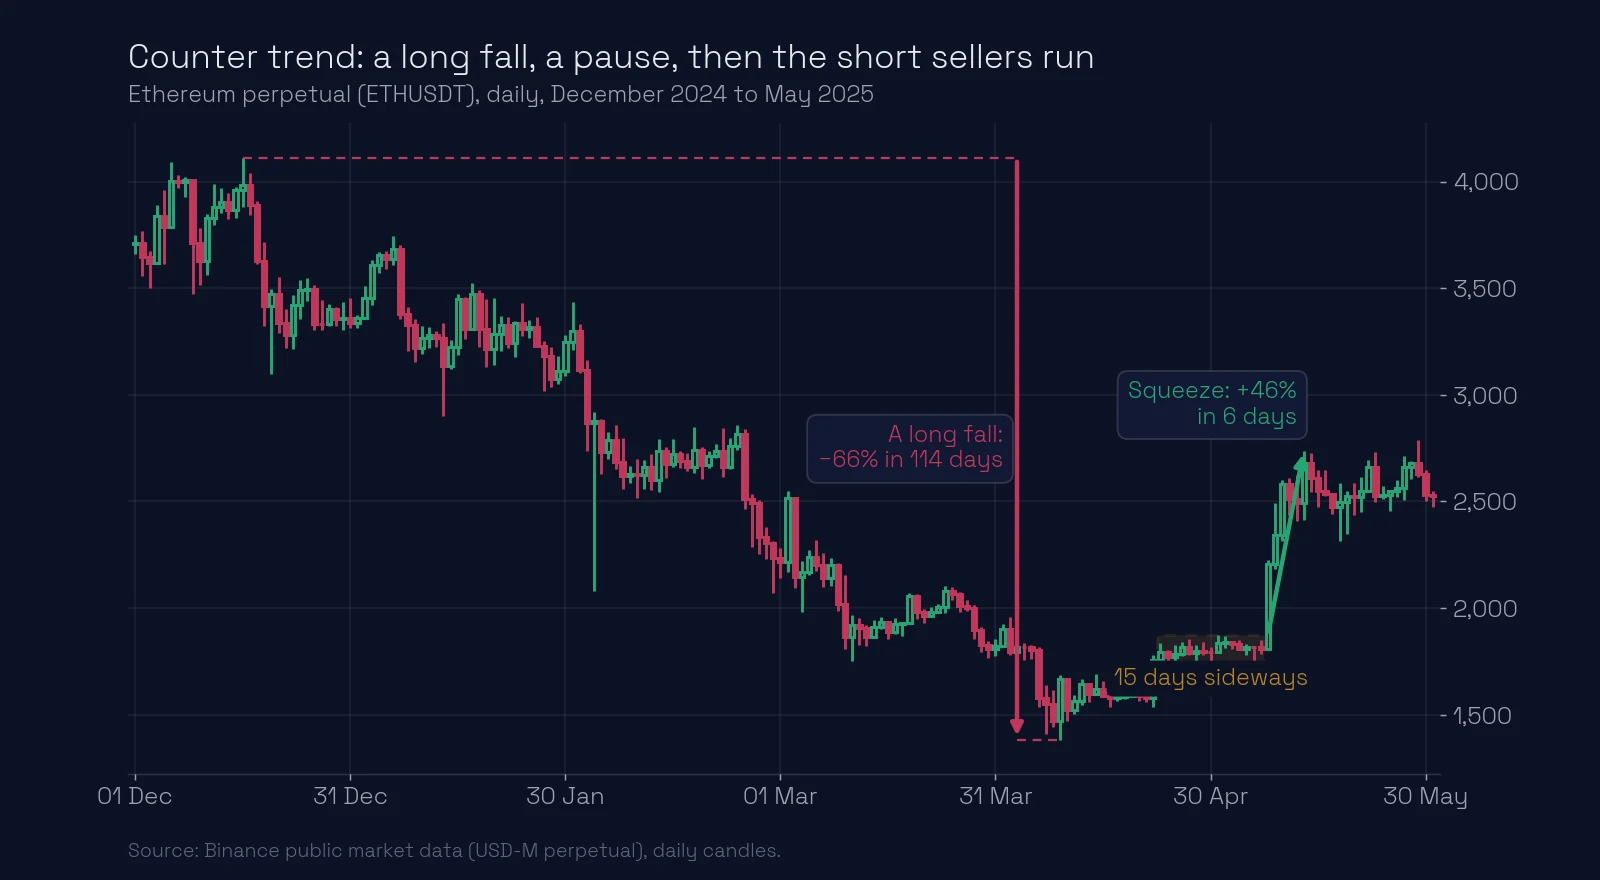
Ethereum fell from 4,109.99 in December 2024 to 1,384.00 in April 2025: 66% in 114 days. From 23 April to 7 May it moved sideways between 1,721.22 and 1,872.71. Then the short sellers ran: in 6 days price rose to 2,738.62, 46% above the top of the channel. On 8 May alone the daily candle was 6.1 times the ATR.
The longer the fall, and the longer the pause after it, the higher the chance of growth. Here both were long: almost four months of falling and two weeks of counter-trend accumulation.
3. News: energy you cannot see on the chart
A report, a release or an announcement can move price more in five minutes than it moves in a normal hour. This energy does not show on the chart in advance; it shows on the calendar.
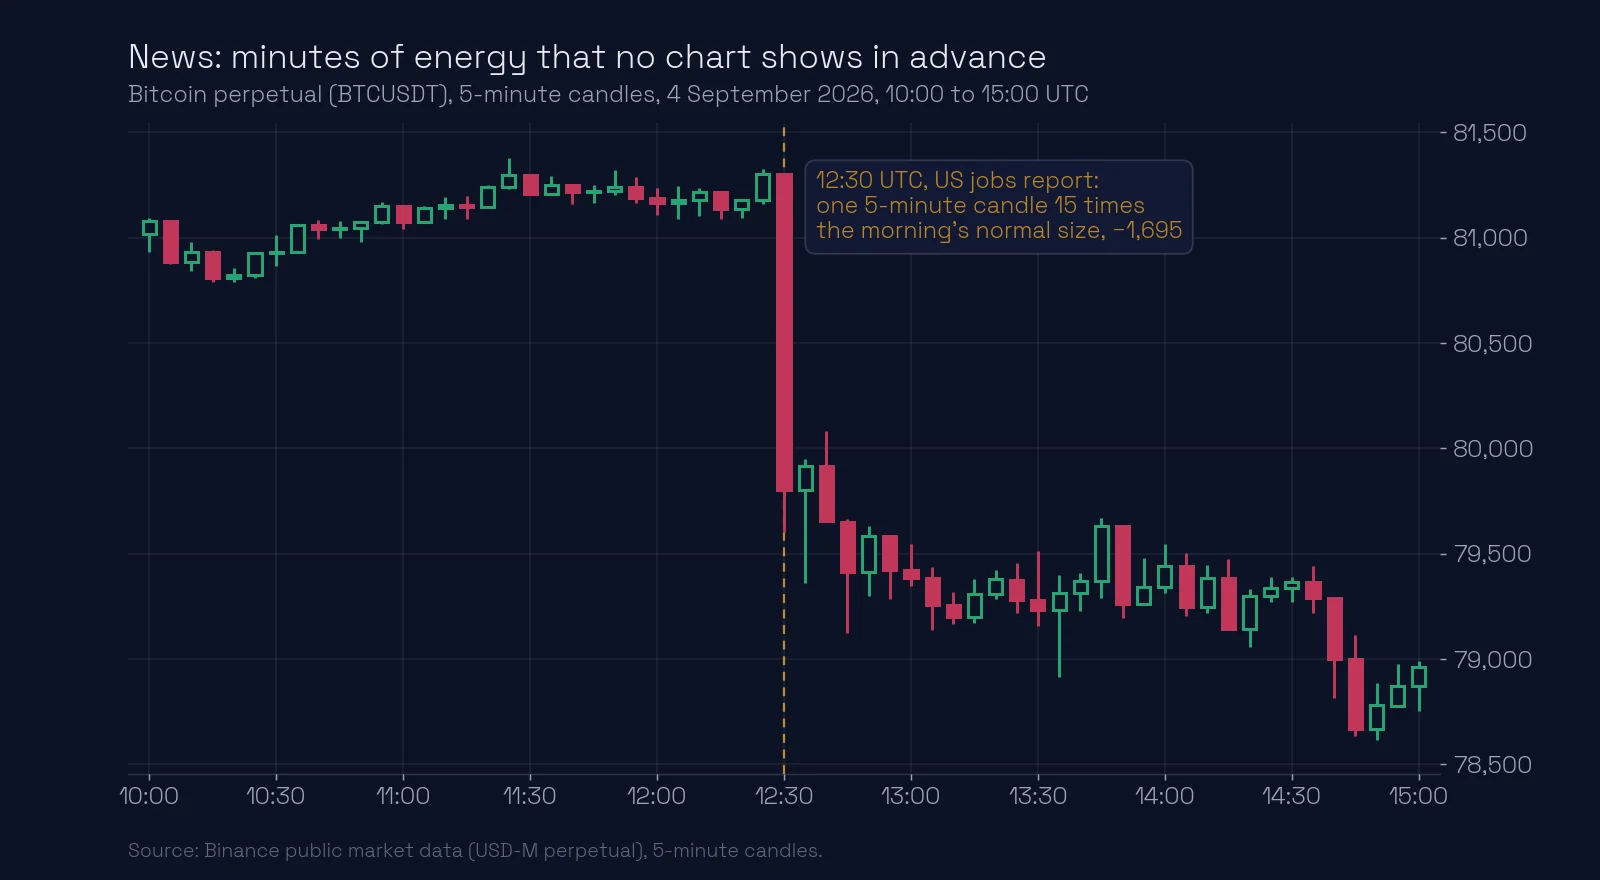
On 4 September 2026 the US jobs report came out at 12:30 UTC. The 5-minute Bitcoin candle at that moment was 1,695 dollars long, about 15 times the size of a normal 5-minute candle that morning. In five minutes price used a large part of the day’s fuel.
News works both ways: it can carry price through a level, or throw it far beyond your stop. So you check the calendar before you plan a trade, never after. See news without a plan.
What most traders miss. Energy is not the same as a big candle. The big candle is energy being spent. The energy itself was stored before it: in the quiet weeks of a channel, or in the months of a fall. Look for the storage, not for the explosion.
No energy, no trade
If you cannot name the energy, there is none you can rely on. A perfect level with no accumulation, no counter trend and no news behind it is a level you watch, not a level you trade. The other two pillars, direction and the entry point, only matter once the energy is there.
Common mistakes
- Planning a level two ATRs away for today. On most days price does not cover that distance. Fix: compare the distance with the fuel left today.
- Calling every big candle energy. A big candle spends energy; it does not promise more. Fix: look for the channel or the long fall before it.
- Forgetting the calendar. News arrives on a schedule. Fix: check the time of reports for your instrument before the session.
- Trading a level with no energy. Fix: name the energy (accumulation, counter trend or news) or do not take the trade.
Key takeaways
- Energy is the second pillar. It answers: can price get there, and can it go beyond?
- Can it get there: compare the distance to the level with the ATR fuel left today. On 59% of days the range stays within one ATR.
- Can it go beyond: name one of three energies. Accumulation stores it in a channel, counter trend builds it during a long fall, and news brings it at a scheduled time.
- The longer the accumulation or the fall, the more energy for the move.
- No energy, no trade.
Lesson test · 6 questions
Check yourself
Can you pass on the first try?
Passing the test completes this lesson. Tests in a module open in order, each after the one before it. A first-try pass scores 100%. Each wrong answer costs 10 points, and every 10 wrong answers lock the test for 30 minutes. Once you pass, your score is final, except that a score of 50 or less can be retaken once.
-
Which two questions does energy answer?
-
What is the ATR?
-
Price has used 80% of today’s ATR and the level is one full ATR away. What do you expect?
-
Which of these is one of the three kinds of energy in this course?
-
An instrument fell for months, then went sideways for two weeks, then jumped sharply up. What kind of energy is this?
-
Why do you check the economic calendar before planning a trade?
Free account
Take the test and keep your score
- Your answers are checked and every lesson you pass is marked complete.
- Your scores build into your course score, on any device.
- You come straight back to this question after signing up.
Next: pillar three, direction.
Related lessons
Educational content, not financial advice. Trading carries a risk of loss.