
I have written before that most breakouts fail. The honest follow-up question is: which ones don’t? After years of watching levels and running backtests, my answer is narrower than most people expect — two structures repeat reliably. Everything else, in my experience, is noise that slowly bleeds accounts.
One caveat before the patterns, because it matters more than the patterns. No setup works for every trader. Even people trained in the same school, reading the same books, end up executing completely different trades — risk appetite, patience, and discipline shape what you can actually follow consistently. What repeats on the chart is objective; what you can trade is personal. These two are the ones that survived my filters.
Pattern 1: the coiled base
This one only exists if there is a real, strong level on the chart first. Without that, there is nothing to coil against.
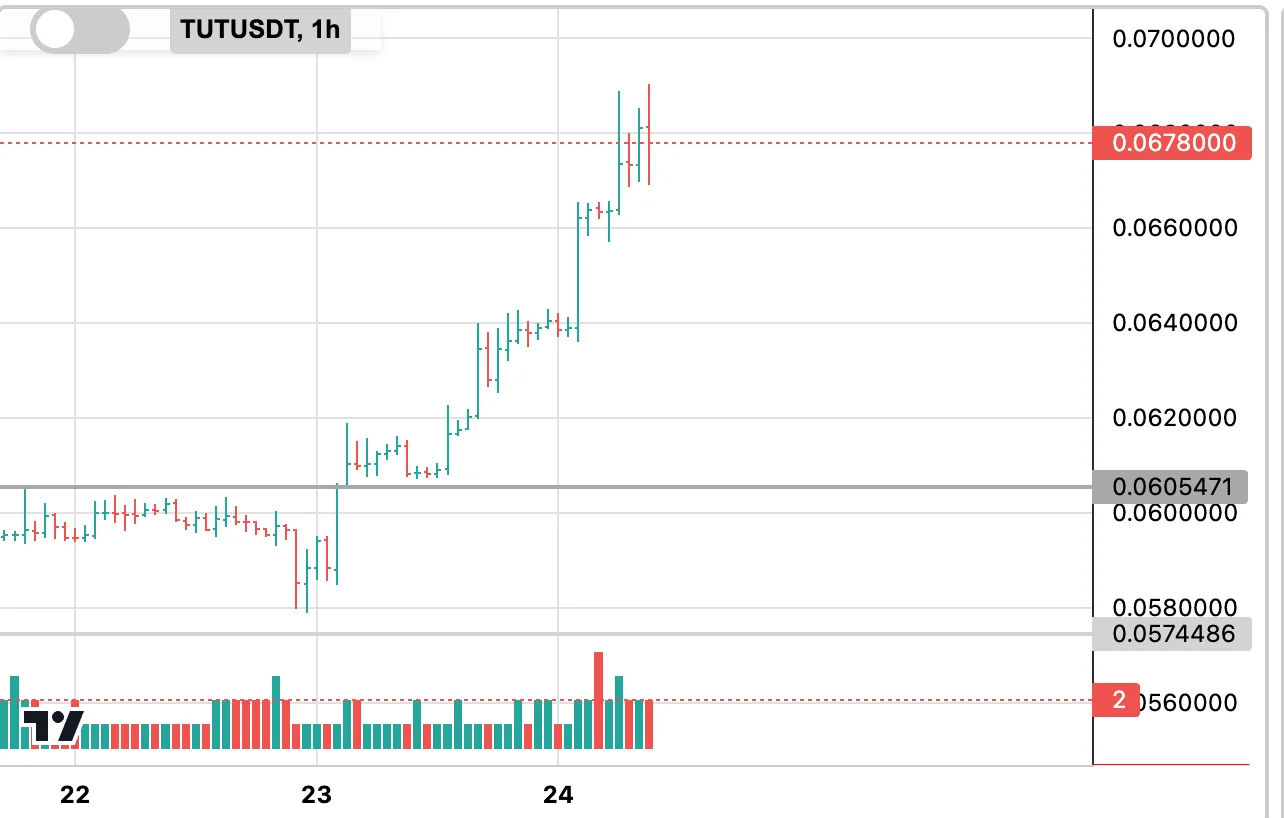
The sequence reads like this:
- Price approaches the level aggressively — big candles, volatility surging well above its normal range.
- Then, just before the level, everything slows. The bars shrink. The volatility that was screaming fades to a whisper.
- A tight base forms directly under the level: multiple touches, shallow retreats, no deep rejections.
That pause is the tell. The aggressive run burned a lot of energy, and to break a wall of resting liquidity the buyers have to stop, reload, and accumulate — right at the level, where it counts. The base is the reload. When it resolves, the move tends to be clean and fast, because everything that could resist was absorbed during the pause.
What makes this pattern trustworthy is everything yesterday’s checklist described: compression at the level, higher lows, and empty space beyond it. What breaks it: a parabolic approach with no pause at all — that’s not a coil, that’s exhaustion.
Pattern 2: the break that holds
The second structure starts where most traders panic: price pokes through the level — sometimes on a single candle — and then does something unusual. Nothing.
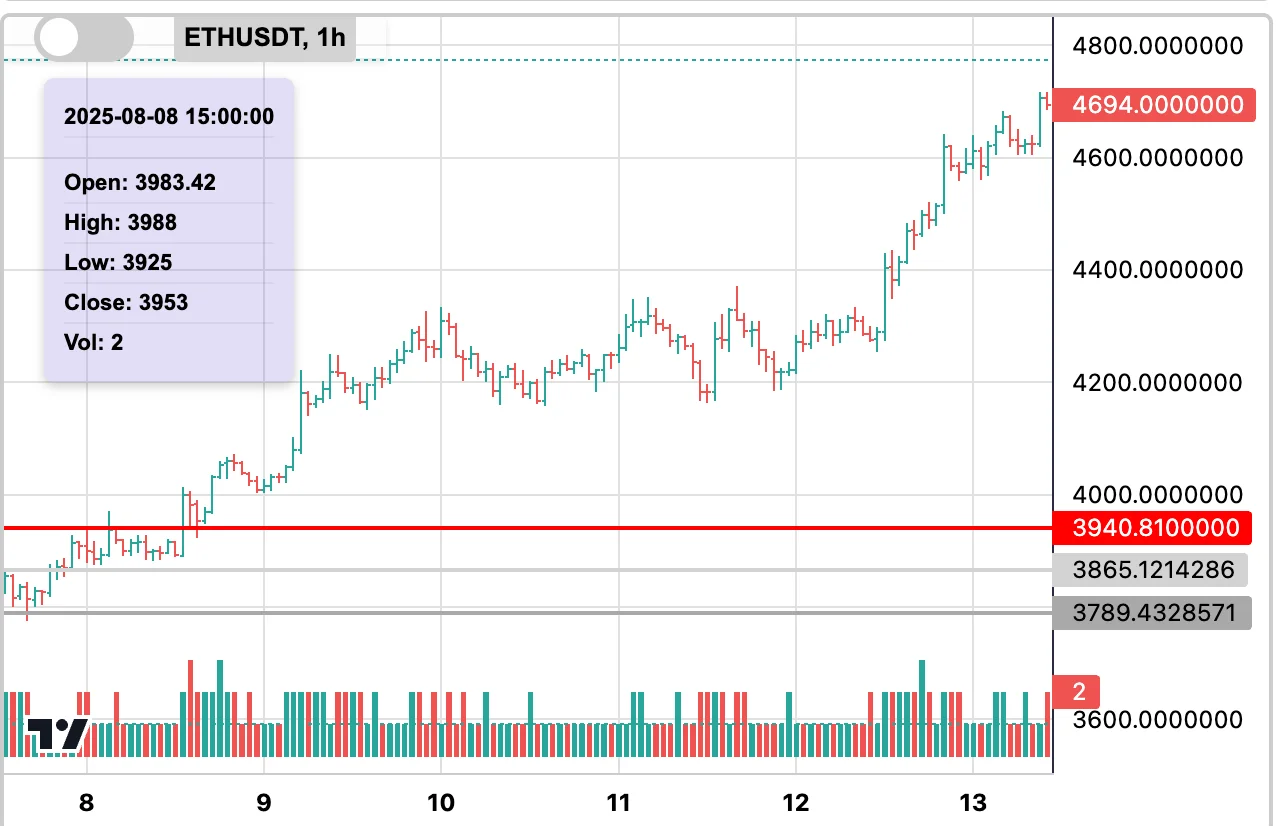
- The level breaks, or is at least breached, with a candle whose body means it (body larger than its wicks).
- Instead of a violent rejection, price hangs near the level. Pullbacks are calm: small candles, no deep selling.
- Then the move resumes in the direction of the break.
Read mechanically, this is strength on display. A false break gets slammed back within a bar or two — that violent rejection is its signature. A break that lingers, absorbs the profit-taking and the doubters, and refuses to give the level back is showing you that the other side has nothing left. The calm pullback is where weak hands hand their positions to strong ones. Old resistance is quietly becoming new support — the mirrored-level behaviour from the seven filters, forming in real time.
What a breakout is not
Worth stating plainly, because these get called “breakouts” every day:
- A green candle through a level is not a breakout.
- A price spike on news is not a breakout.
- A break with no base underneath it is not a breakout.
If you can’t point at the accumulation that powers the move, you are not looking at a breakout. You are looking at a trap — and traps are Friday’s topic.
A short word on risk
Both patterns describe probabilities, not certainties, and every breakout structure begins with somebody on the wrong side. Two boring principles decide whether being wrong is an event or a catastrophe: stop-losses cap the damage, and low leverage buys the breathing room to think. The market doesn’t reward bravery. It rewards structured repetition.
Finding levels where a coil is forming — before the release, across every market at once — is exactly what ChartThread does.