Support and resistance zones vs levels: why an exact price wins
Many traders draw support and resistance as wide shaded boxes. In this course a level is always one number. Here is why that matters in money.
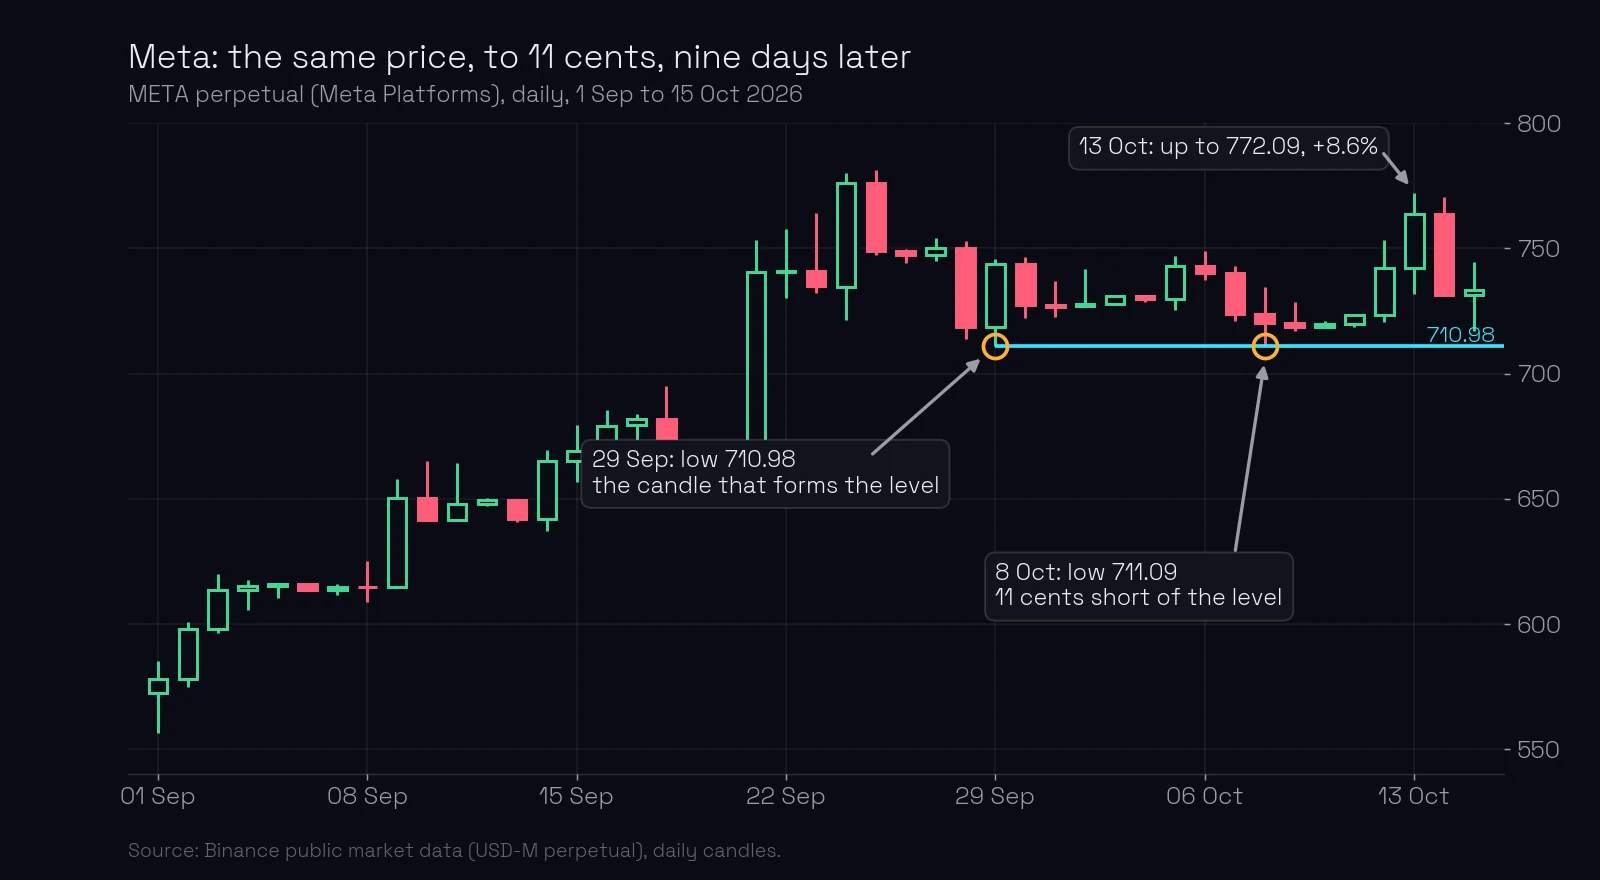
On 29 September 2026 Meta’s perpetual contract fell to 710.98 and was thrown back. Nine days later price came down again and stopped at 711.09, eleven cents above that low. The daily range at the time was about 21 dollars. Price chose the same price, almost to the cent.
What you’ll learn
- Why a level is an exact number, not a zone or a range.
- Which price of a candle makes the level, and which never does.
- What “falling a little short of the level” means.
- How a zone makes your stop several times longer, with real numbers.
A level is a number, not a zone
A level is always an exact price. Not “the 700 area”, not a band between two prices, not a box. One number, such as 710.98.
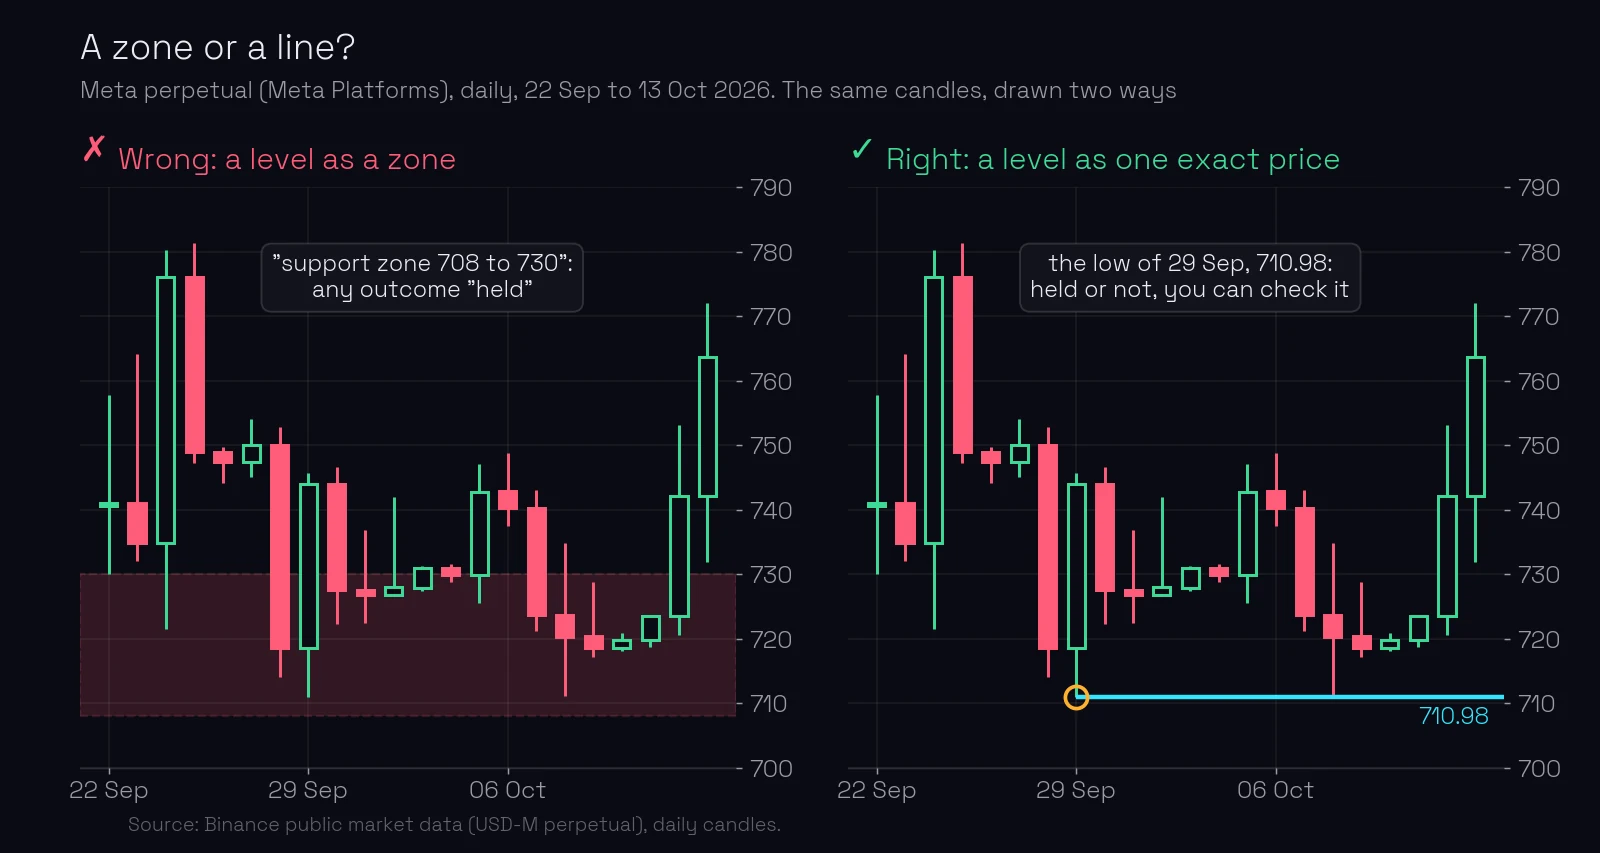
The reason is who stands behind a level. A big player who buys a large amount puts a limit order at a chosen price, and price is stopped exactly there, because that is where the volume is. The orders do not sit “somewhere around”. They sit at a price. When price returns, it meets them at the same place again, which is what you saw on Meta.
An exact number also keeps you honest. A zone can absorb any outcome: price went a little through it, it still “held”. A number is either respected or not, and you can check that after every touch.
Which price makes the level
A level is formed only by the high or the low of a candle. Never by the open, never by the close, never by an average of several candles.
The high and the low are where the trading actually stopped. The open and the close are just the first and the last trade of a period, set by the clock. On a daily chart the close is wherever price happened to be at midnight UTC. Nobody defends that price.
Every level has its own candle: the bar that formed the level. On Meta it is the candle of 29 September, and its low, 710.98, is the level. Finding that candle is the subject of the candle that forms a level.
“A little short” is part of the level
Price does not always touch the level exactly. Often it stops a little short, as on Meta (11 cents) or on Palantir below (8 cents). That is still a reaction to the level.
How much is “a little” cannot be set in cents for all instruments. It depends on the chart: 11 cents is nothing on a share that moves 21 dollars a day, and a lot on one that moves 50 cents. Look at the instrument’s normal daily range, the average true range (ATR), and at how price behaved around the level before. Candles that almost touch the level make it stronger, and that has its own lesson: near misses.
A level still stays a number. “Falling a little short” tells you the level worked. It does not turn the level into a zone.
A zone makes the stop several times longer
The more precise the level, the shorter the stop-loss it allows. This is where the zone costs real money.
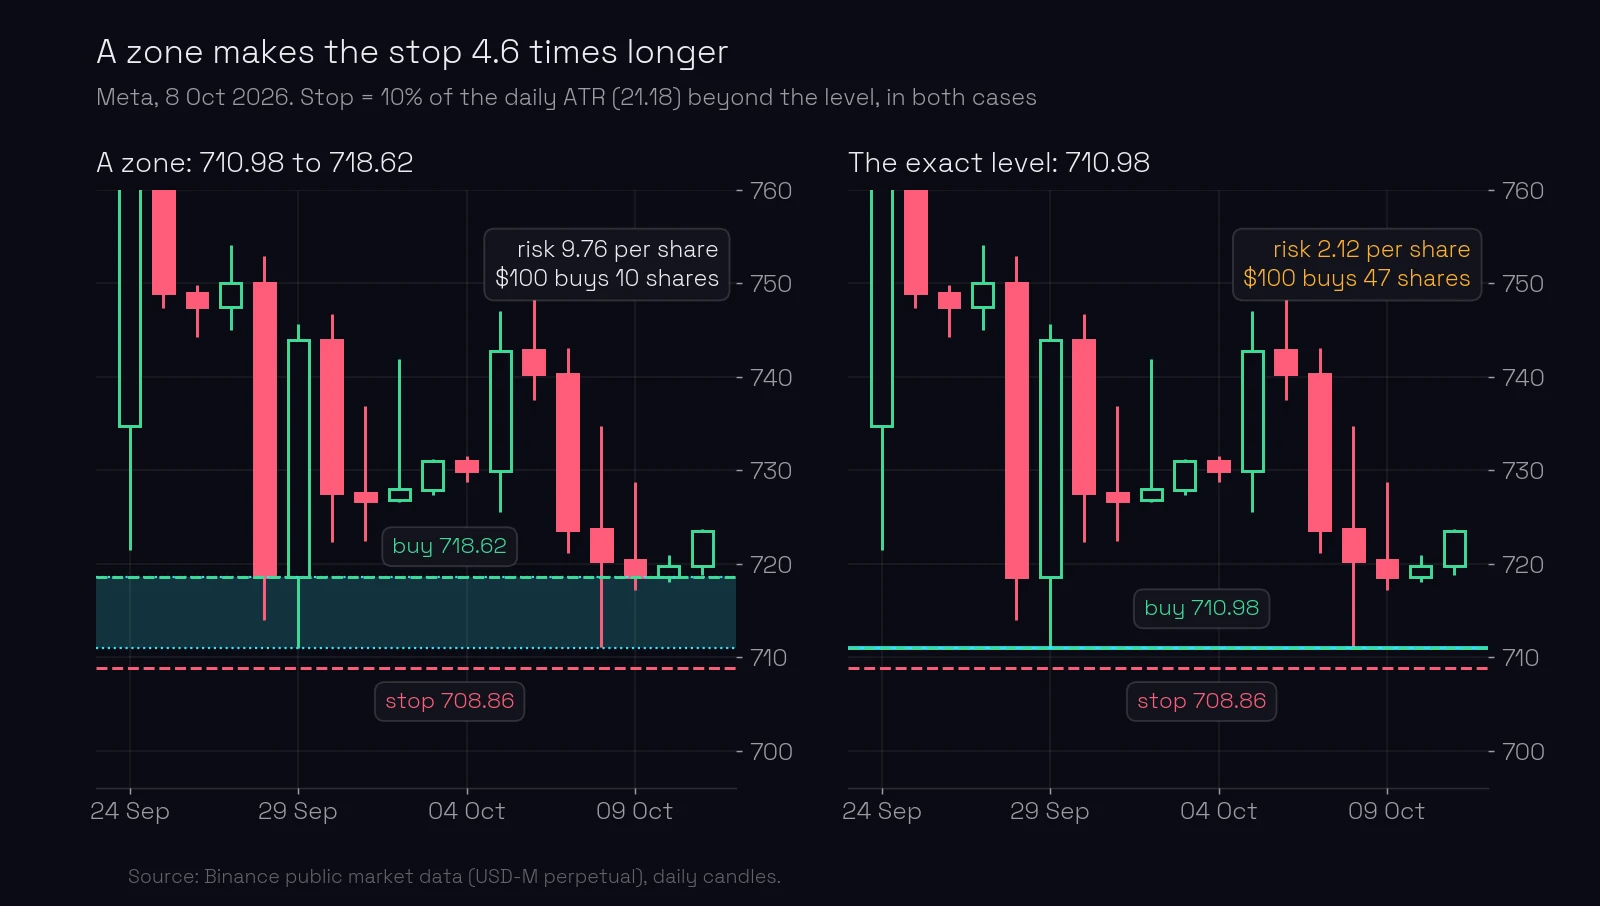
Example: the same Meta trade with a zone and with a level
Take the Meta chart on 8 October 2026. The daily ATR was 21.18. The course places the stop 10% of the daily ATR beyond the level: 2.12.
With a zone. A zone trader shades the area from the low, 710.98, up to the lowest close nearby, 718.62. They buy when price enters the zone, at 718.62, and put the stop below the zone:
- Stop: 710.98 − 2.12 = 708.86
- Risk per share: 718.62 − 708.86 = 9.76
- With $100 of risk: 100 ÷ 9.76 = 10 shares
With the exact level. You buy at the level and put the stop the same distance below it:
- Stop: 710.98 − 2.12 = 708.86
- Risk per share: 710.98 − 708.86 = 2.12
- With $100 of risk: 100 ÷ 2.12 = 47 shares
Same chart, same idea, same $100 at risk. The zone makes the stop 4.6 times longer, so the position is 4.6 times smaller, and every dollar the trade earns is cut by the same factor. Price went up to 772.09 by 13 October.
(A week later, on 16 October, price closed below 710.98 and the level was broken. No level is guaranteed. The exact price is what lets you lose 2.12 a share when it fails, not 9.76.)
A second example: Palantir’s 161.52
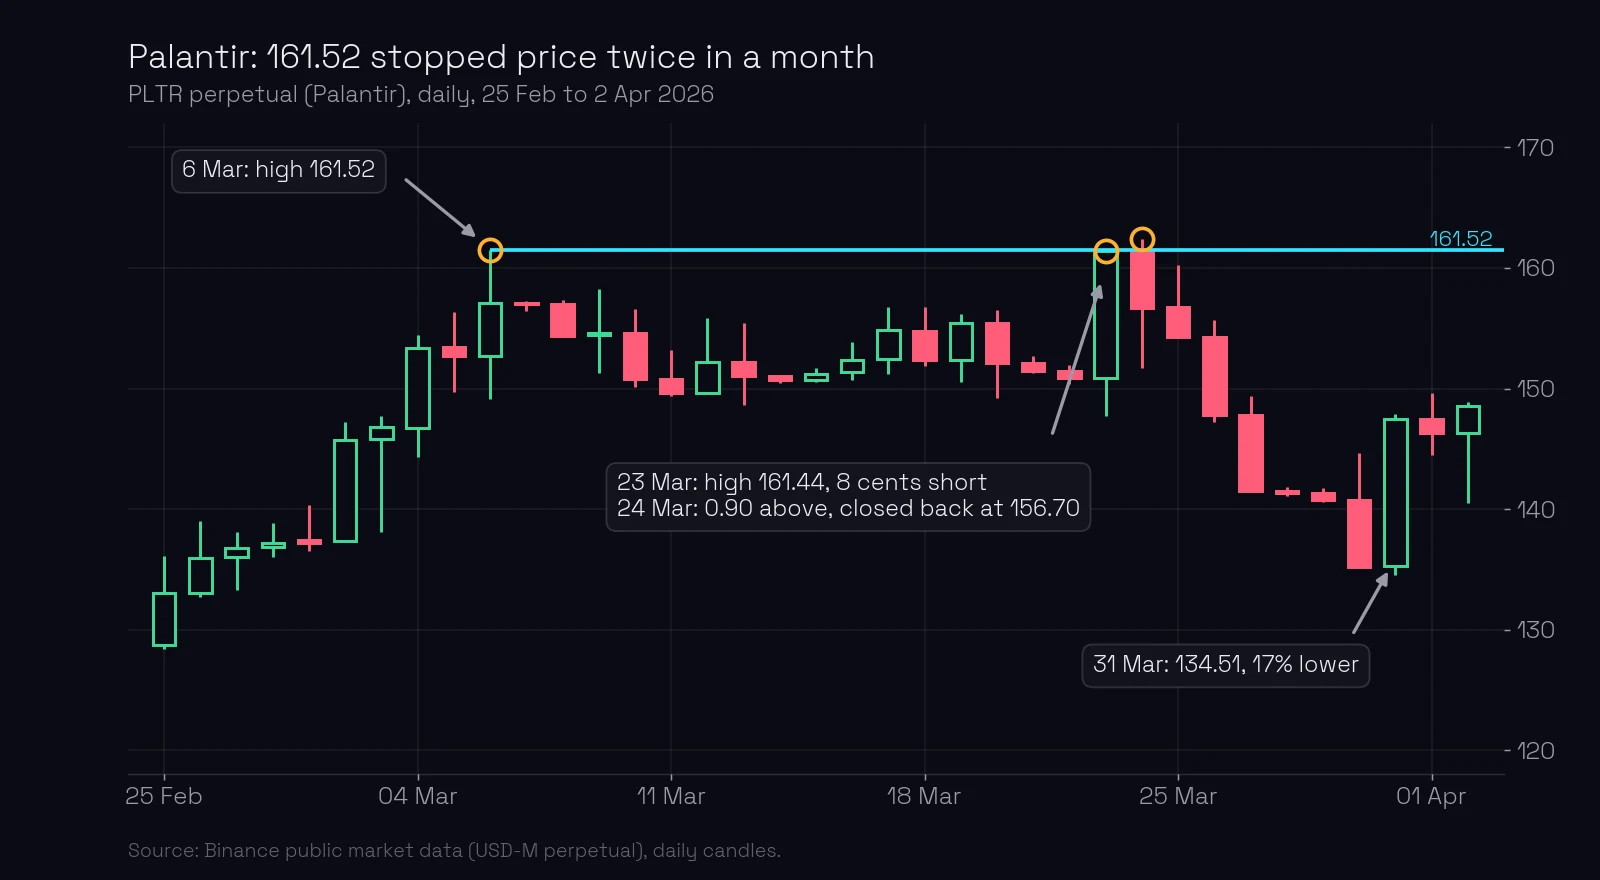
On 6 March 2026 Palantir’s contract rose to 161.52 and turned down. For two weeks price traded below. On 23 March it rallied hard and stopped at 161.44, 8 cents short. On 24 March it went 0.90 above the level, could not hold, and closed back at 156.70. By 31 March price was at 134.51, 17% lower.
Look at the size of that poke: 0.90 when the daily ATR was 4.89, less than a fifth of a normal day. A short, shallow trip beyond the level that closes back does not weaken it. It is a false breakout, and a shallow one makes the level stronger (more in shallow false breakouts).
What most traders miss. A zone feels safer because it is “harder to miss”. It is the opposite. The wider the area you call a level, the further away your stop has to be, and the smaller the position you can afford for the same risk. Precision is not a matter of taste: it is what makes a short stop possible. The more powerful the level, the shorter the stop it allows.
Common mistakes
- Drawing a box instead of a line. A zone hides whether the level held. Fix: write the level down as one number, taken from a real candle.
- Using the close or the candle body. The close is set by the clock, not by a player. Fix: take the exact high or low of the candle that formed the level.
- Rounding the number. 710.98 is a level; “about 711” is a guess. Fix: copy the price to the last digit the exchange shows.
- Calling a near miss a failed level. Stopping a little short is a reaction. Fix: judge “a little” against the instrument’s daily range, not in fixed cents.
Key takeaways
- A level is always an exact number, never a zone or a range.
- It is taken only from the high or low of a candle, never the open, close or an average.
- Falling a little short of the level still counts; “a little” is relative to the chart.
- The more precise the level, the shorter the stop. On Meta, a zone made the stop 4.6 times longer.
Lesson test · 7 questions
Check yourself
Can you pass on the first try?
Passing the test completes this lesson. Tests in a module open in order, each after the one before it. A first-try pass scores 100%. Each wrong answer costs 10 points, and every 10 wrong answers lock the test for 30 minutes. Once you pass, your score is final, except that a score of 50 or less can be retaken once.
-
What is a level in this course?
-
A daily candle opened at 120.40, rose to 124.85, fell to 119.60 and closed at 123.10. Which prices can form a level?
-
Why does the course take the high or low and not the close of a candle?
-
Price comes back to a level at 500.00. On that day the instrument’s daily ATR is 20.00, and the stop goes 10% of the ATR beyond the level. You buy at the level. Where is the stop, and what is the risk per share?
-
Same chart, but a zone trader buys at the top of a zone, 506.00, with the stop also at 498.00. With $100 of risk, how many shares does each trader buy?
-
Price stops 6 cents short of a level on a share with a daily ATR of 15 dollars. How do you read it?
-
Price went 0.90 above a level, when the daily ATR was 4.89, and closed back below. What happened to the level?
Free account
Take the test and keep your score
- Your answers are checked and every lesson you pass is marked complete.
- Your scores build into your course score, on any device.
- You come straight back to this question after signing up.
Next: how to draw a level, step by step. ChartThread draws levels the same way, as exact prices from real candles: see them on the levels page.
Terms in this lesson
Related lessons
Educational content, not financial advice. Trading carries a risk of loss.