The four pillars of a trade · Lesson 6 of 6
Example: one trade checked against all four pillars
The four pillars only work together. In this lesson we take one real trade and check it against all four, in the order you would do it: the homework on the daily chart the evening before, then the entry on the 5-minute chart. Then we run the same checklist on a level that looked tempting and was not a trade.
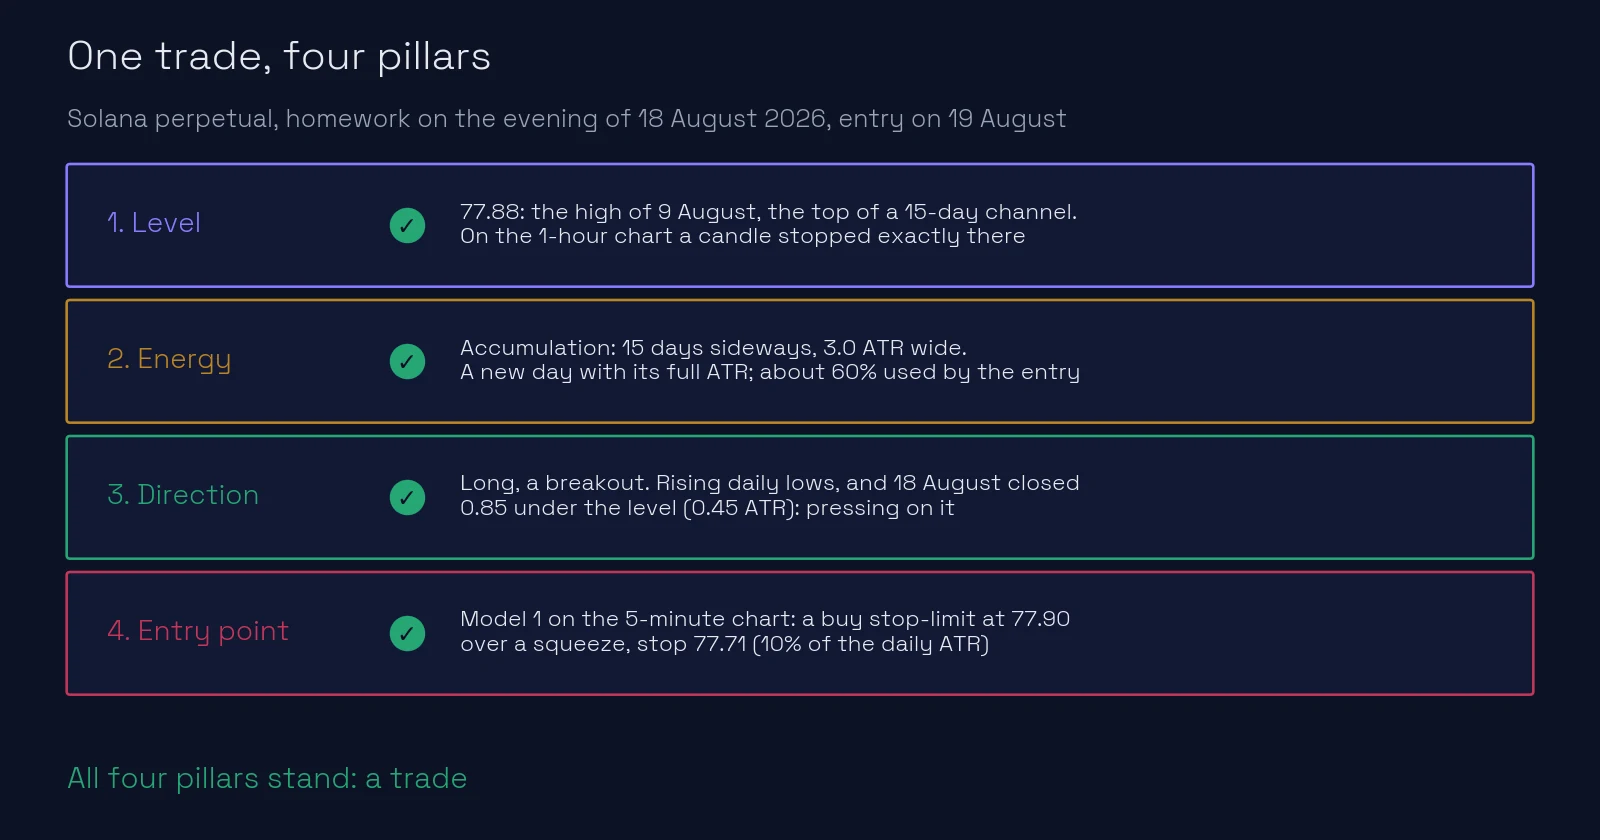
What you’ll learn
- How the four pillars are checked one after another, on real data.
- What the homework looks like the evening before.
- How the entry and the stop follow from the plan.
- Why the same checklist says no to most levels.
The homework: the evening of 18 August 2026
Pillar 1: the level
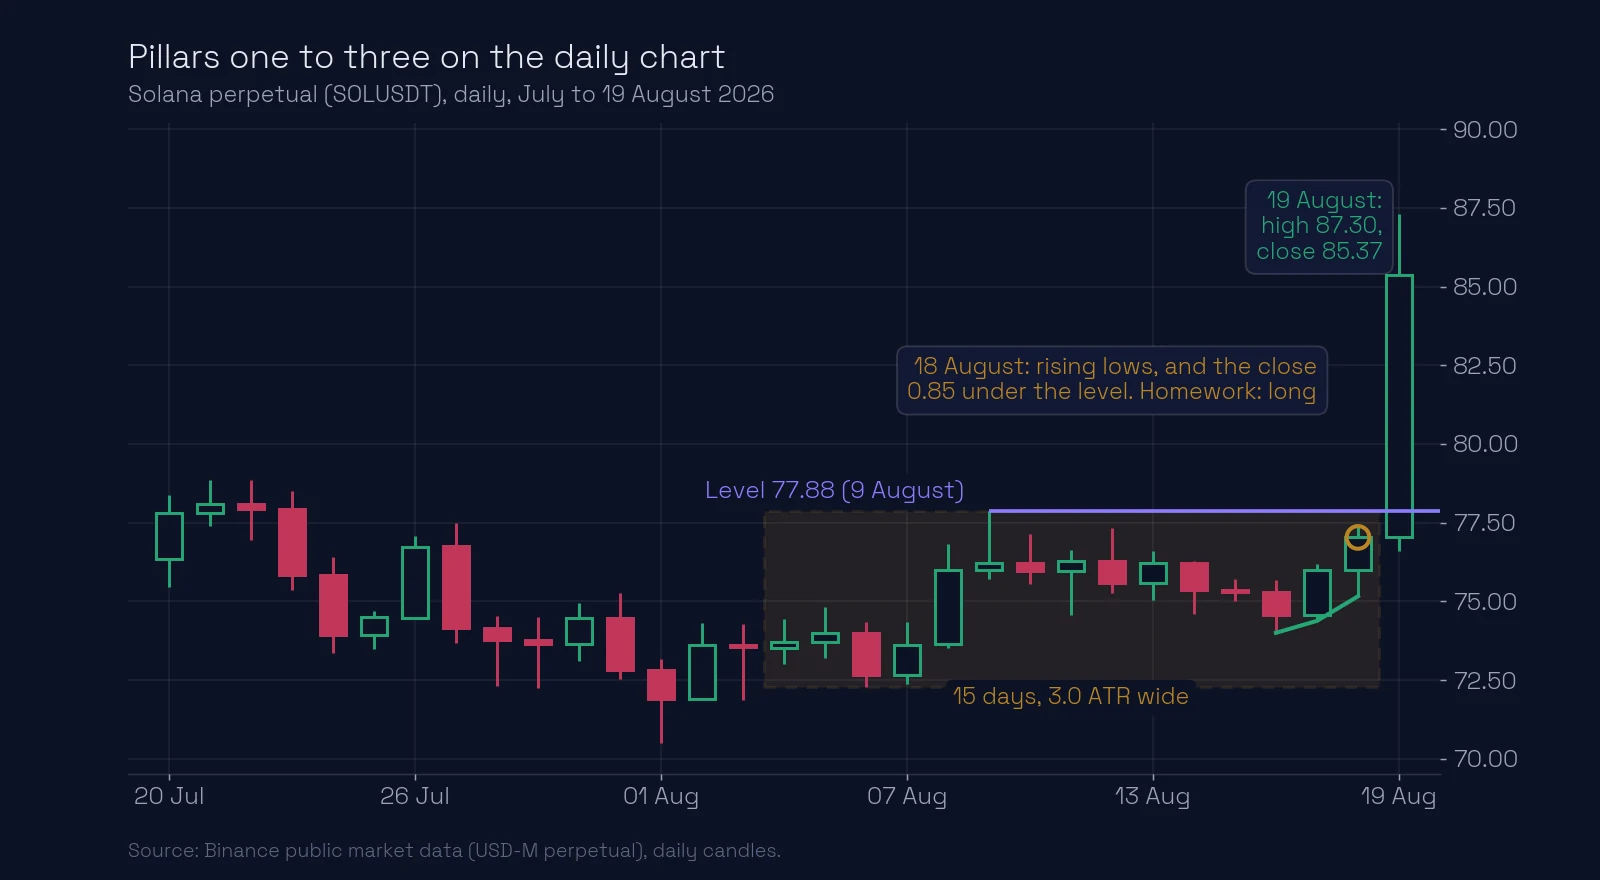
The level is 77.88, the high of 9 August. It is the top of a channel in which Solana traded from 4 to 18 August, and on 12 and 18 August price stopped just short of it, at 77.33 and 77.39. Its story is clear: the edge of an accumulation, confirmed by the candles inside it. See pillar one.
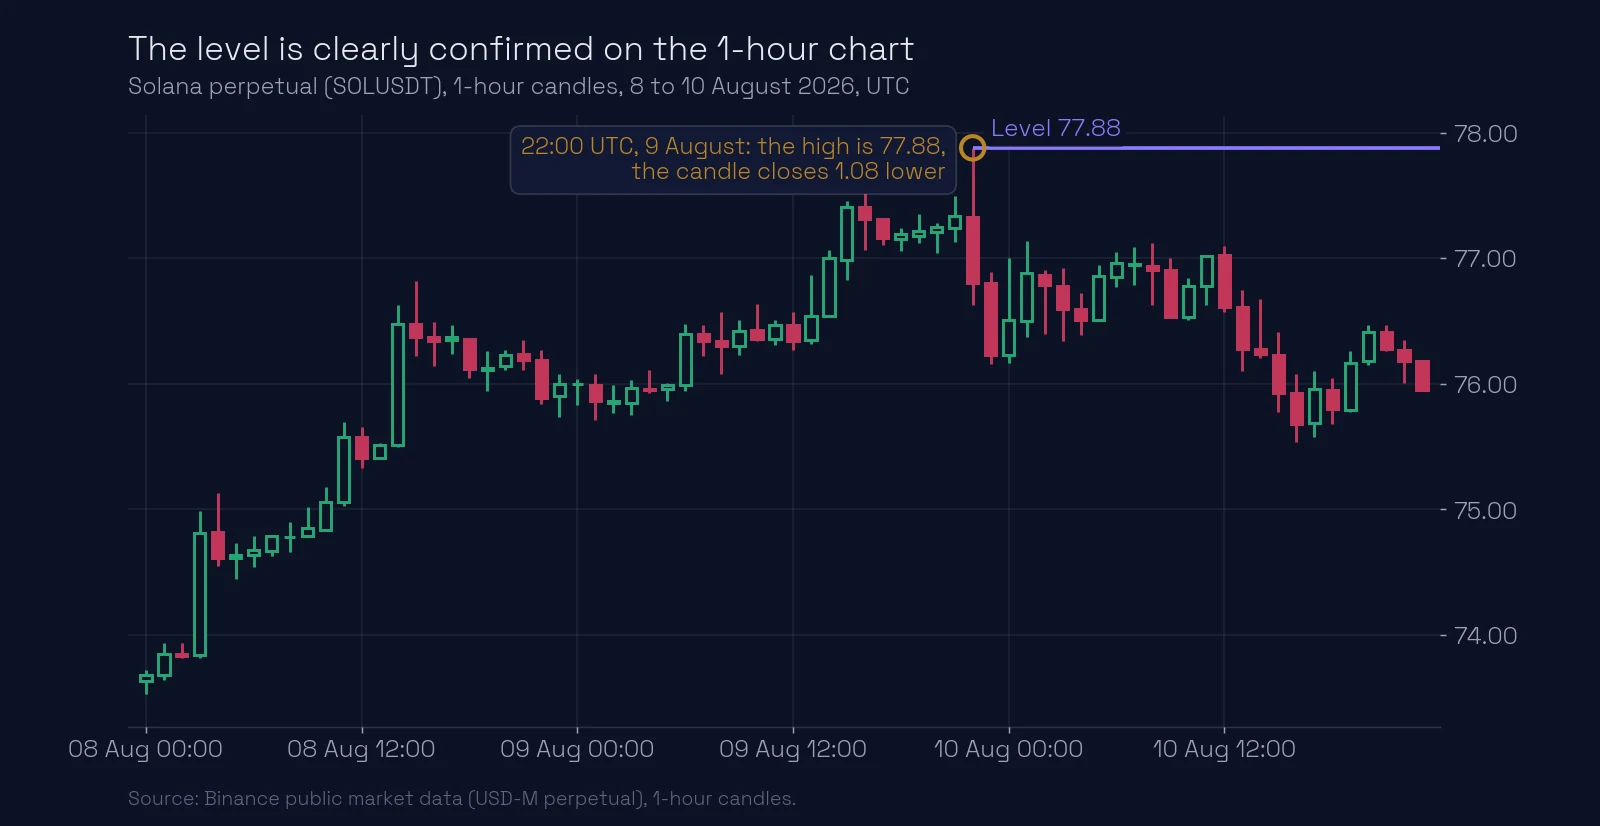
The level must also be clearly visible on the 1-hour chart. It is: the 22:00 UTC candle of 9 August reached exactly 77.88 and closed 1.08 lower.
Pillar 2: energy
The energy is accumulation: 15 days sideways between 72.29 and 77.88, a channel 3.0 ATR wide. That is a long, tight consolidation right under the level. And the next day starts fresh, with its whole daily ATR of fuel (1.89). See pillar two.
Pillar 3: direction
The direction is long: a breakout up through the level above. The minimum set of prerequisites for a breakout is in place:
- Accumulation under the level, 15 days.
- Rising lows: 74.00 on 16 August, 74.38 on 17 August, 75.16 on 18 August.
- The close near the level: on 18 August Solana closed at 77.03, only 0.85 under the level (0.45 ATR). The buyer pushed all day and stopped right there.
Nothing points the other way: no abnormal candle or sell-out candle into the level, no long move without a pullback. See pillar three.
The homework, written down: “Solana, level 77.88. Long. Above 77.88 I buy, on the 5-minute chart, stop behind the level at 10% of the daily ATR.” One level, one direction, and the reasons.
Pillar 4: the entry, 19 August
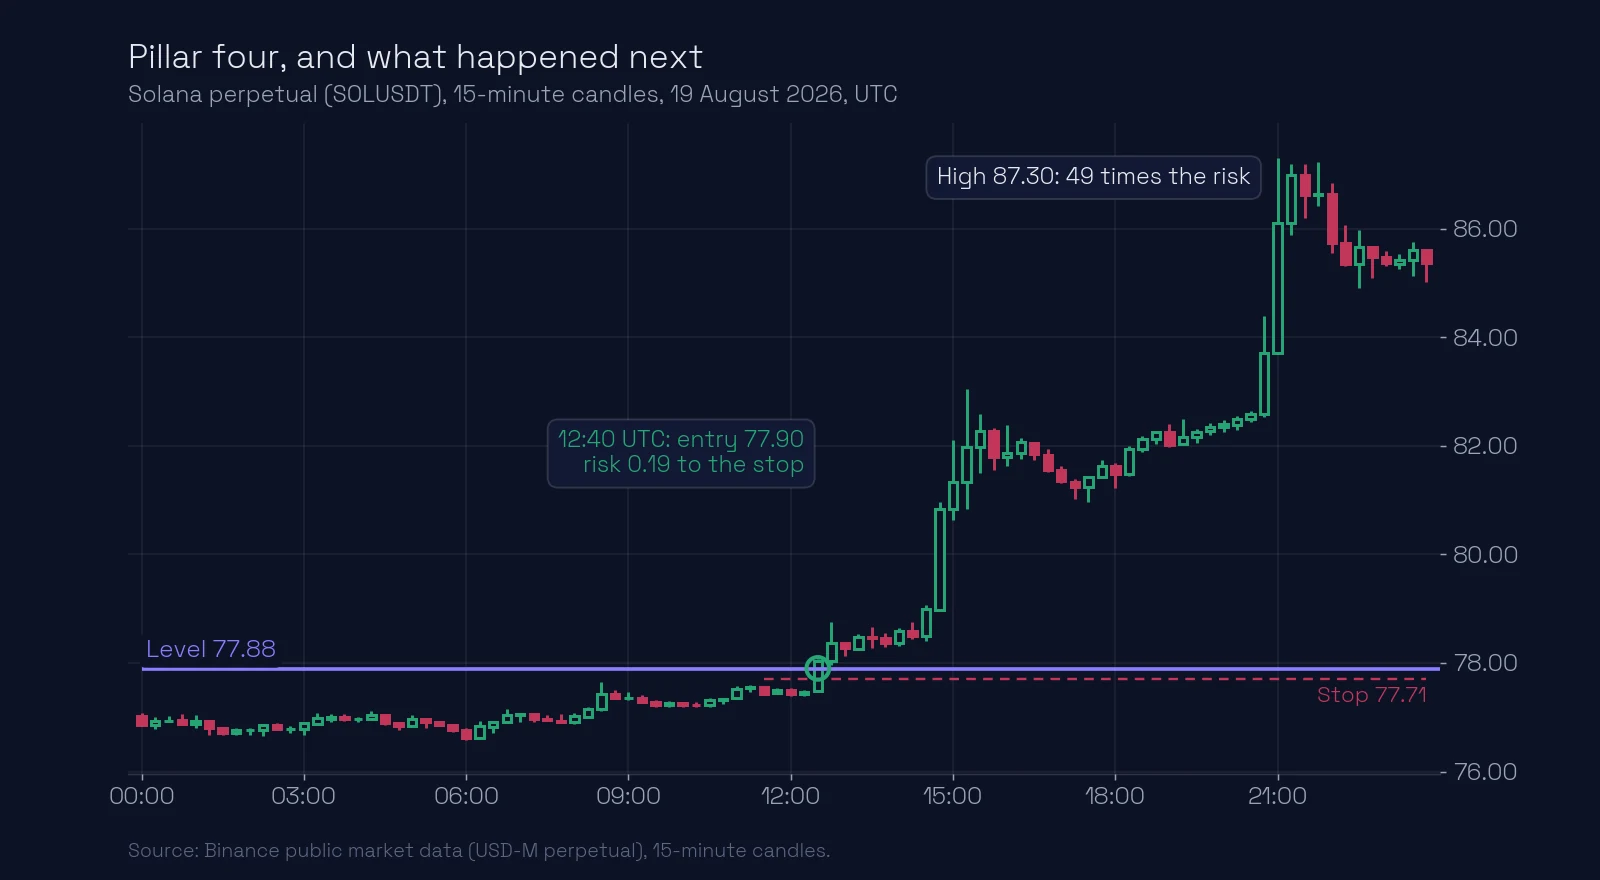
On the morning of 19 August price stayed under the level. From 12:20 to 12:35 UTC the 5-minute lows rose: 77.42, 77.43, 77.47, 77.55. That is the squeeze of entry model 1.
- The order: a buy stop-limit at 77.90, 2 ticks above the level.
- The stop: 77.71, 10% of the daily ATR (0.19) below the entry, behind the level. Placed together with the entry order.
- The fuel check: by the time the order filled at 12:40, the day had used about 60% of its ATR. Under 80%: there was fuel left for the break.
The result
After the fill, price never came back below 77.97, so the stop at 77.71 was never in danger. The high of the day was 87.30, 49 times the risk of 0.19; the day closed at 85.37, 39 times the risk. Three days later Solana traded at 102.84.
Be clear about what this shows. It is an exceptional result, chosen because every pillar is easy to see. Most trades that pass the checklist move much less, and some hit the stop. The checklist does not promise a winner; it makes sure you only take trades where the probability is on your side and the loss is small and known in advance. When and where to take the profit is a subject of its own, in risk management.
The same checklist says no
Most levels fail the checklist, and that is its main job. Here is one that looked tempting.
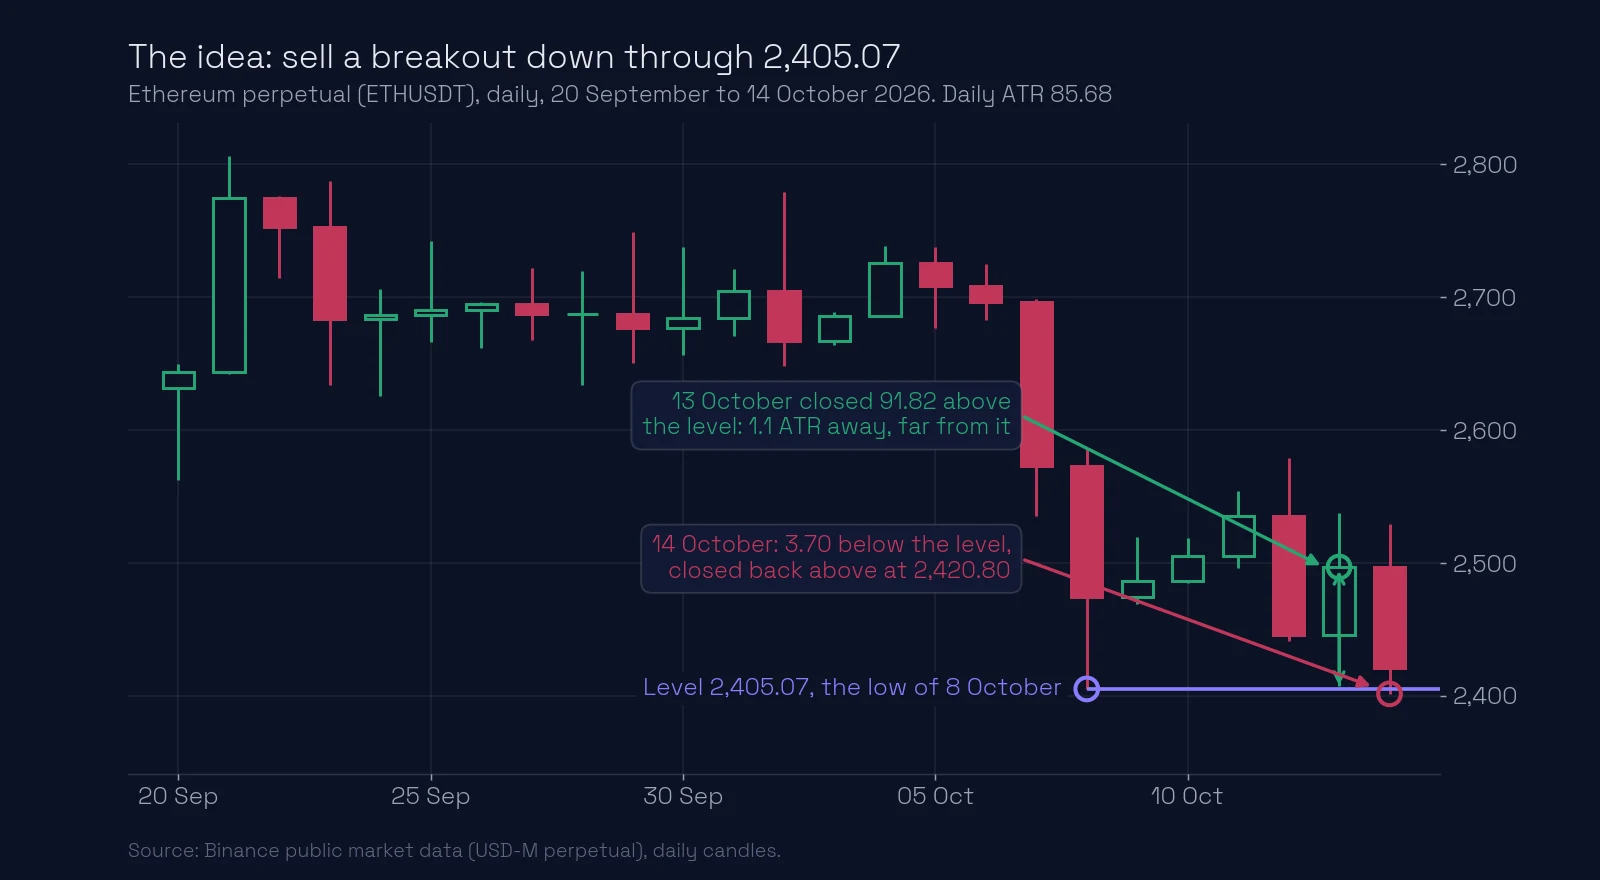
The trade idea: Ethereum, 14 October 2026. Sell short if price breaks down through 2,405.07, the low of 8 October, where a fall had stopped. Price was falling towards that level all day, so a breakdown looked likely.
Now the four questions, one by one:
- Level: yes. 2,405.07 is a real level with a clear story: on 8 October a fall stopped exactly there (daily chart).
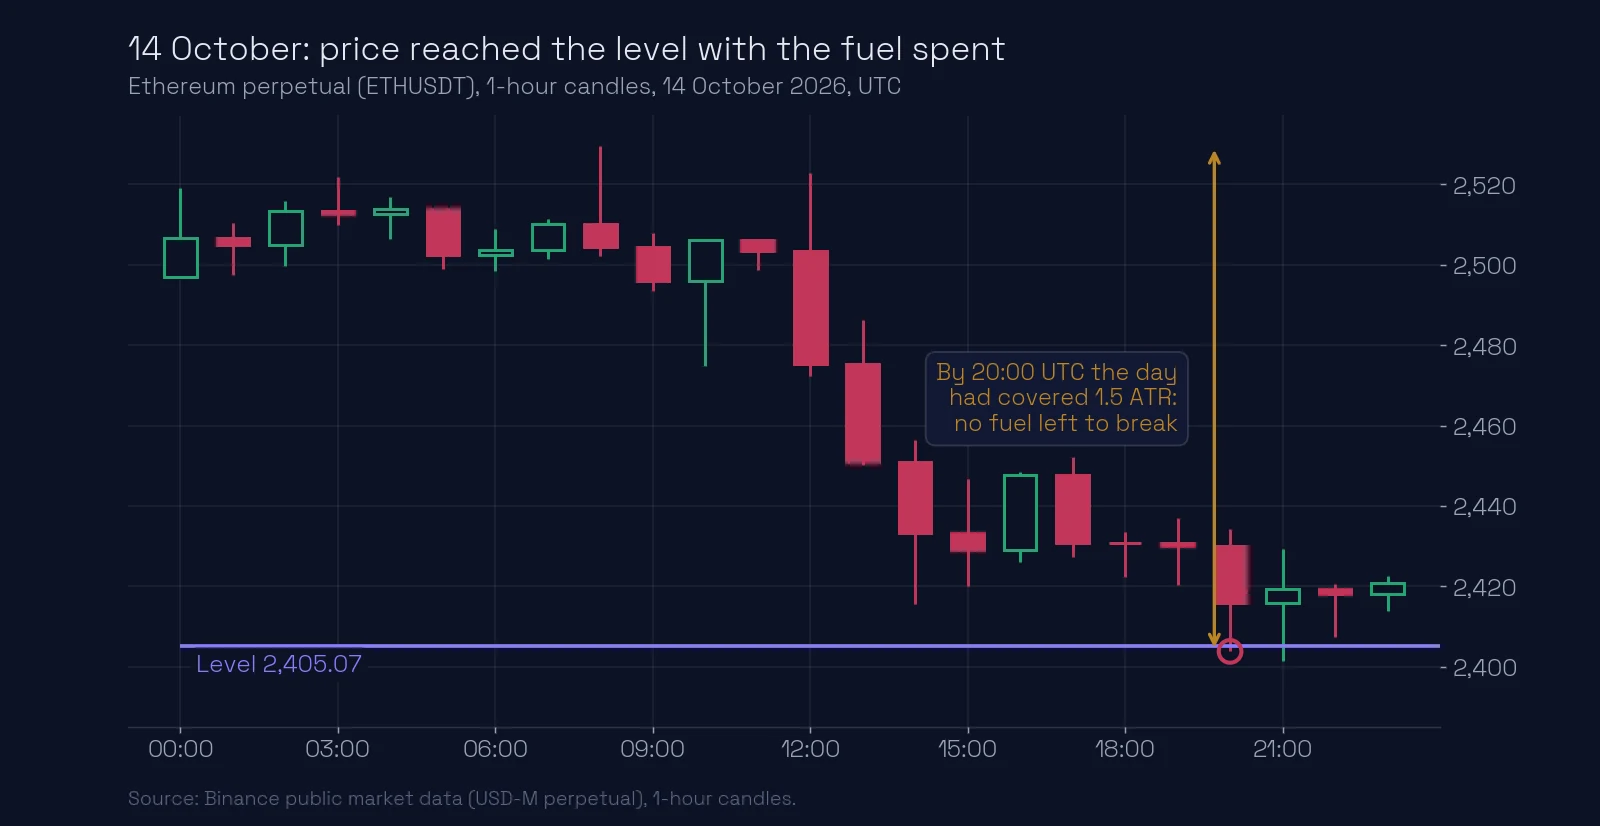
- Energy: no. The daily ATR was 85.68. On 14 October price first went up to 2,529.57, then fell, and reached the level only at 20:00 UTC. By then the day had covered 1.5 times its ATR (1-hour chart). The day’s fuel was spent before price even got to the level.
- Direction: no. For a breakout, yesterday should close near the level, pressing on it. On 13 October Ethereum closed 91.82 above the level, 1.1 ATR away (daily chart). That is far from it, a prerequisite for a bounce, not for a breakout.
- Entry point: none. With energy and direction missing, there is nothing to enter.
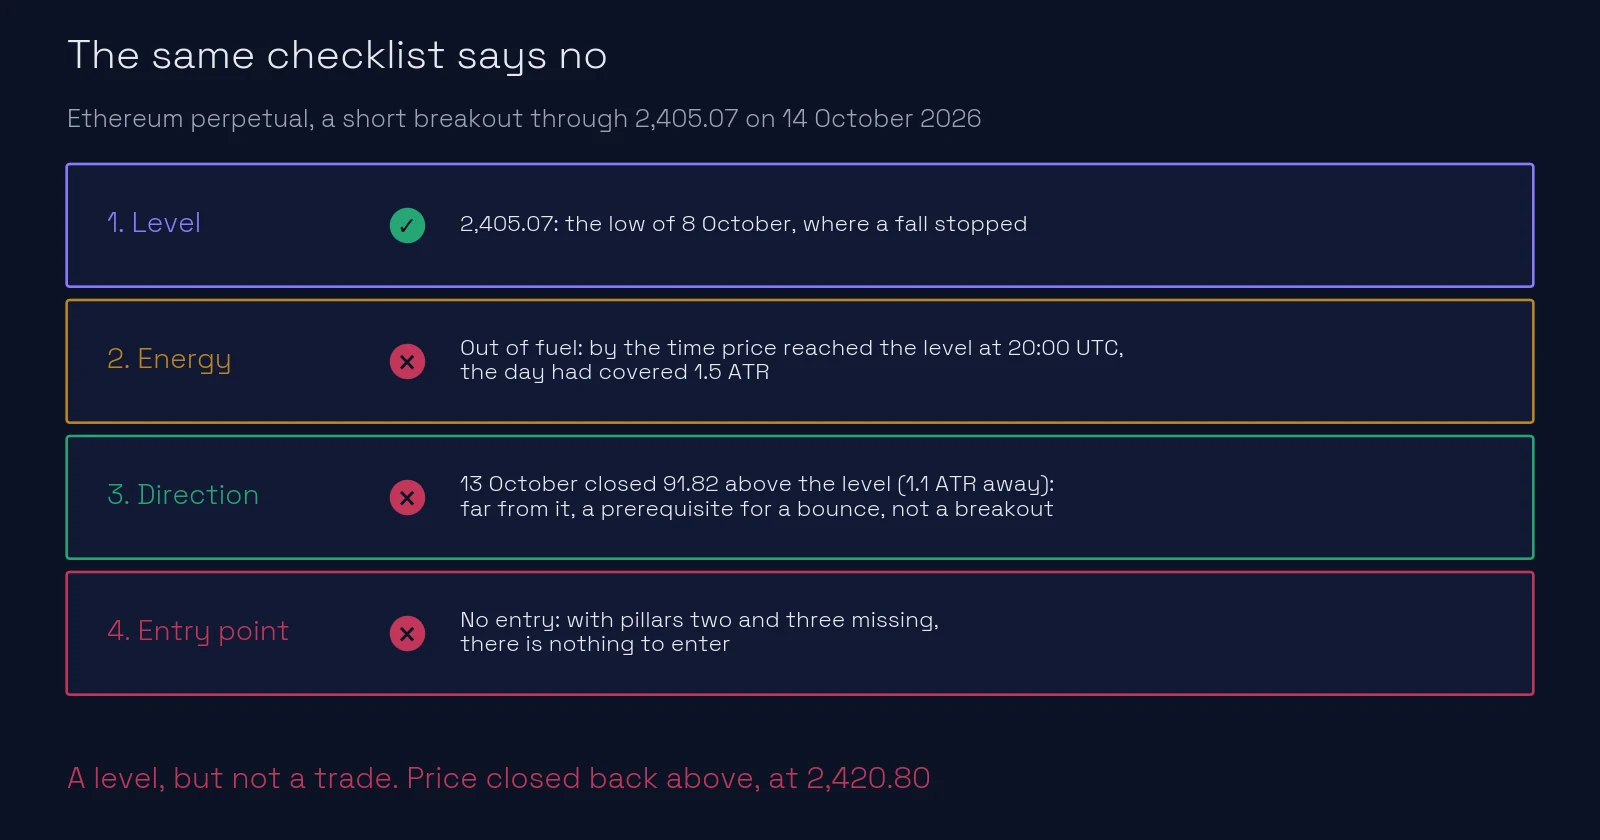
What happened: price went only 3.70 below the level, to 2,401.37, and closed the day back above it, at 2,420.80. A trader who sold the “breakdown” was caught in a false breakout. The checklist kept you out. We looked at this day in pillar three.
What most traders miss. The checklist is mostly a filter. On most days, for most levels, at least one pillar is missing, and the right decision is to wait. A trader who checks all four pillars trades less, and loses less.
Your checklist before every trade
Ask the four questions in this order, and write the answers in your homework:
- Level: what is the exact price, and what event made it? Is it confirmed on the daily and the 1-hour chart?
- Energy: what will move price there and beyond: accumulation, counter trend or news? Is there fuel left in today’s ATR?
- Direction: long or short? Which prerequisites support it, and do any point the other way?
- Entry point: which entry model, which order, and where exactly is the stop, behind the level and within 10% of the daily ATR?
If any answer is “I don’t know”, there is no trade. To find level candidates for the first question, open ChartThread’s levels page.
Key takeaways
- The four pillars are checked in order: level, energy, direction on the daily chart the evening before; the entry on the 5-minute chart.
- Solana on 19 August 2026 passed all four: level 77.88, 15 days of accumulation, a long breakout with the close pressing on the level, entry model 1 with a 0.19 stop.
- Its result was exceptional; the checklist promises a small, known loss, not a winner.
- Ethereum’s 2,405.07 on 14 October 2026 was a valid level but failed on energy and direction: no trade.
- If any of the four answers is missing, wait.
Lesson test · 5 questions
Check yourself
Can you pass on the first try?
Passing the test completes this lesson. Tests in a module open in order, each after the one before it. A first-try pass scores 100%. Each wrong answer costs 10 points, and every 10 wrong answers lock the test for 30 minutes. Once you pass, your score is final, except that a score of 50 or less can be retaken once.
-
In which order are the four pillars checked?
-
On the evening of 18 August 2026, Solana closed 0.85 under the level 77.88 after 15 days of accumulation. Which direction did the homework name?
-
The daily ATR was 1.89 and the entry 77.90. Where did the stop go?
-
Ethereum reached a clear level after the day had already covered 1.5 ATR. What does the checklist say?
-
What does the four-pillar checklist promise?
Free account
Take the test and keep your score
- Your answers are checked and every lesson you pass is marked complete.
- Your scores build into your course score, on any device.
- You come straight back to this question after signing up.
Course certificate
Earn the ChartThread Four pillars of a trade certificate
Pass every four pillars of a trade lesson test with a score above 50, and ChartThread issues you a certificate with your name: a badge on your learning profile and a PDF you can download and share.
This is the last lesson of the four pillars. Next, each pillar in depth, starting with levels.
Related lessons
Educational content, not financial advice. Trading carries a risk of loss.