
Yesterday’s article dissected why breakouts fail. Today, the flip side: once a breakout has failed, the failure itself is one of the most informative events on a chart. Traders call it a fakeout — a move that breaks a key level and cannot continue, reverses back, and leaves everyone who chased it trapped on the wrong side. Those trapped positions become the fuel for the move in the opposite direction.
In the simplest terms: a breakout is continuation. A fakeout is rejection wearing a breakout’s clothes. The whole skill is telling them apart in real time.
Where fakeouts live
Fakeouts only mean something at real levels. Noise doesn’t fake out — noise just chops. The levels worth watching are the ones that pass real filters: daily-timeframe structures with weight, refined on the hourly for precision, never conjured out of five-minute wiggles.
And the preconditions are exactly the red flags from yesterday: an impulsive, no-base approach, or a break so obvious and crowded that everyone who wanted in was already in. Either way, the break has no second wave behind it.
The two shapes a failed break repeats
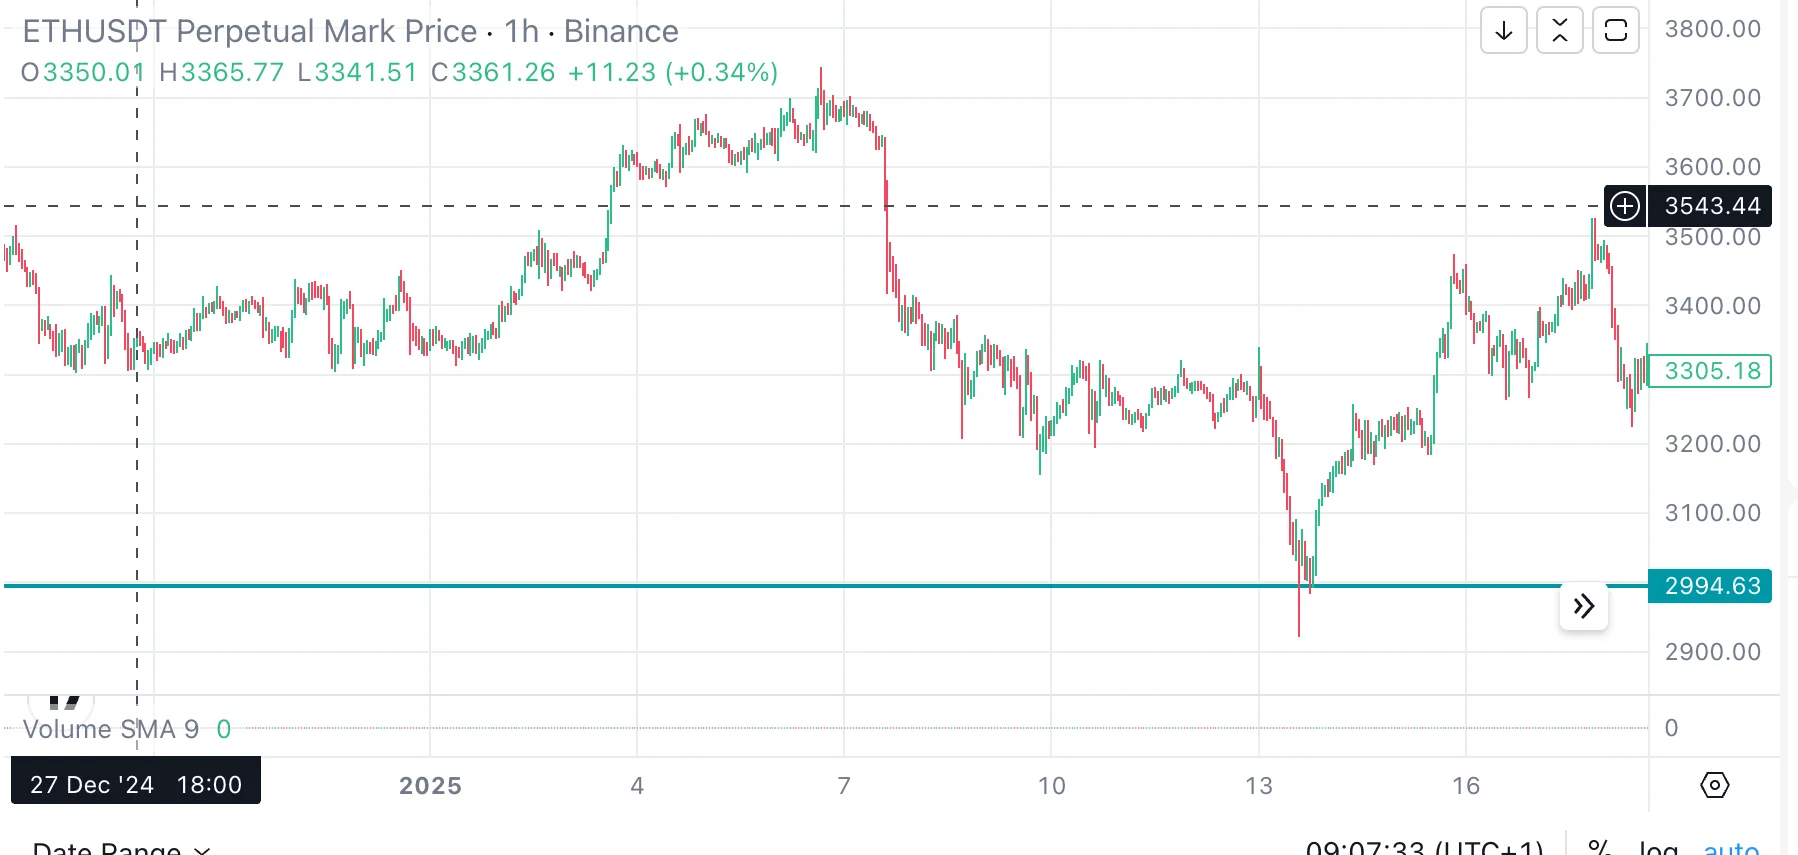
The single-spike rejection. Price breaches the level by a small margin — often one candle, often ending in a long wick — and immediately closes back on the original side. No follow-through at all: volume dries up, momentum stalls, and the level flips from broken to lid within a bar or two. Mechanically, the spike did its job for the other side: the stops resting beyond the level were collected, the liquidity there was consumed, and with the weak hands flushed, the market is free to move the opposite way. The chart above is exactly this shape — one probe below the level, nothing found, immediate reclaim.
The double-tap trap. The subtler version. The first breakout fails as above, price drifts back toward the middle of the range, then makes a second, weaker attempt at the same level — a micro-range, sometimes a second small false break — and gets rejected again. The second failure is the confirmation: the first flush removed the early chasers, and even with them gone, price still can’t hold the far side. Two failed attempts at the same level, the second weaker than the first, is about as clear as the market gets about which way it doesn’t want to go.
Telling a break from a fake while it happens
The comparison that matters, condensed:
| Signal | Real breakout | Fakeout |
|---|---|---|
| Price after the break | Accelerates | Stalls, then reverses |
| Volume | Expands with the move | Spikes on the break, then dies |
| Structure | Holds beyond the level | Closes back inside the old range |
| The break candle | Small or no wick | Long wick, engulfed quickly |
| Follow-up candles | Directional, confident | Hesitant, overlapping |
The unifying thread: a real break keeps proving itself after the level, while a fake spends everything on the crossing. Which is why the patient version of reading either one is the same — never judge the break candle; judge what happens in the two or three candles after it.
Where they thrive, where they don’t
Fakeouts concentrate where the fuel for a trap is richest: after extended moves, when the instrument is exhausted; at psychological round numbers and prior highs, where stops cluster; and when sentiment is crowded and everyone is leaning on the same obvious break. They are least meaningful in low-volume chop and around contaminated zones — a dirty level can’t produce a clean signal, fake or real.
Fakeouts punish the assumption of continuation, which is the most human assumption on a chart. That is the entire reason they exist, and the reason they repeat.
A footnote from the archive: when I first wrote about fakeouts on Medium a year ago, I ended by asking readers whether they’d want a tool that automatically plots live, filtered levels for any instrument — the thing I was quietly building. That tool is ChartThread, and watching levels for exactly these events is what it does all day.