
Most traps on a chart come from looking only at the chart in front of you. A level, a pattern, volume kicking in — everything local says go. But every local picture lives inside a bigger one, and if you’re betting against the larger tide, the market will eventually drown the trade no matter how clean the setup looked.
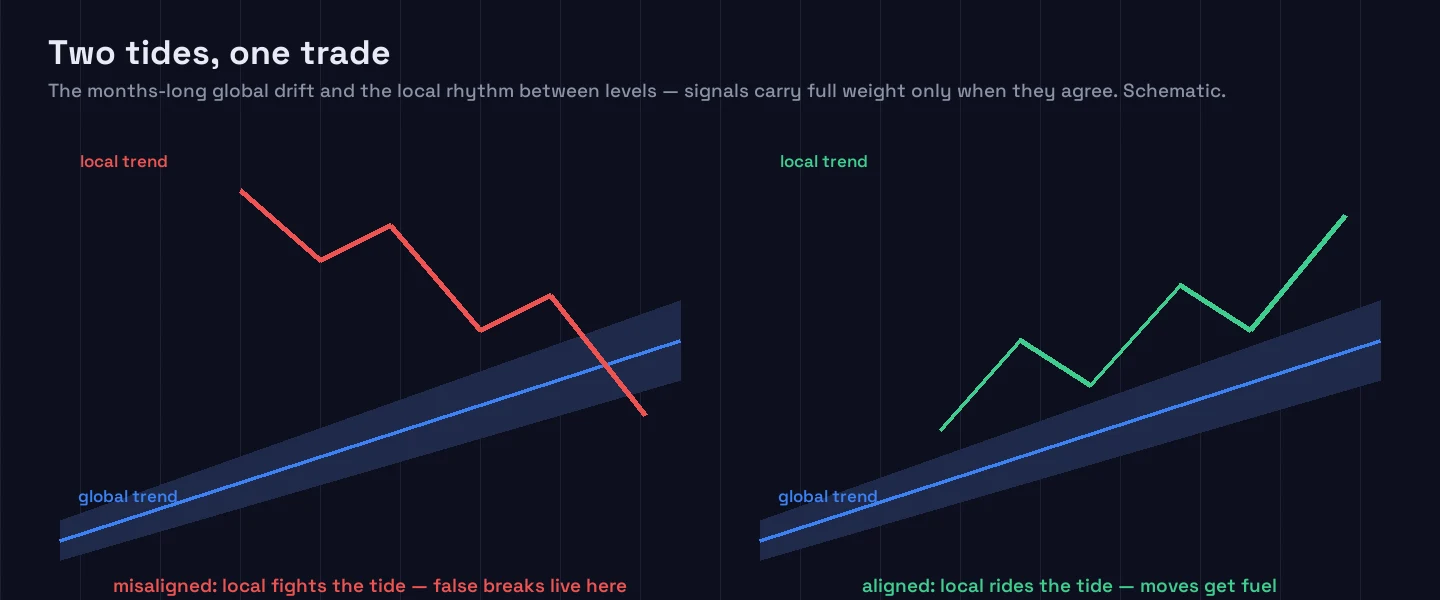
The two tides
Think of any market as moving in two dimensions at once:
- The global trend — the broad drift that dominates over months. The half-year direction; the macro tide pulling everything one way.
- The local trend — the shorter rhythm formed between nearby levels, the picture you see zoomed into daily or hourly charts, where the current battle actually is.
Both carry weight. When they agree, a move accelerates like a ship with wind and current behind it. When they diverge, you’re rowing against one force while being pulled by the other — and in that fight, the position is usually what breaks.
How misalignment kills clean setups
Picture a market grinding upward for six months while a local chart approaches resistance with weak pullbacks and no base — locally, it looks short-ready. But every short there is fighting an army of background buyers that the local frame doesn’t show. That background bid is precisely where many false breakdowns come from.
The reverse fails the same way: a textbook local breakout — clean level, accumulation, volume — suffocates quickly if the global market is bleeding. The pattern was real; the context vetoed it.
I learned this the expensive way. I once shorted a picture-perfect local weakness: a sharp V-shaped approach into resistance, fading candles, drying volume. Everything this series teaches said the level would hold. But the asset was six months into a global uptrend with capital still flooding in, and the short collapsed within hours. What I read as exhaustion was, in the larger frame, just a pause before continuation. The local analysis wasn’t wrong — it was outvoted.
What alignment looks like
Three checks, before any local signal gets full weight:
- Both trends point the same way. The six-month drift is up and the recent weeks print higher lows — you’re not fighting the market, you’re riding it.
- Accumulation in both frames. The local buildup at the level echoes a larger buildup in the bigger picture — two gears locking together.
- No open contradiction. If global says long and local screams short, the honest answer is neither: wait. Patience is cheaper than a stop-loss.
This expands filter six of the seven level filters into its own discipline: a level’s test means most when the hour, the volume, and the tide all agree with it.
Zoom out before you zoom in
The habit this leaves is simple. Every time a level looks interesting, ask the wider question first: am I with both tides, or about to be crushed between them? A breakout with local fuel and global drift behind it isn’t just a breakout — it’s a breakout with the ocean pushing.
Alignment isn’t a refinement. It’s survival.
ChartThread tracks levels inside their larger structure precisely so the local picture never hides the tide — see how it reads your markets at chartthread.com/levels.