
There’s a simple fact that gets ignored more than any other on a chart: price can lie, but volume rarely does. Candles show you what happened to the last traded price. Volume shows you how much money stood behind it — and intent is much harder to fake when it has to be paid for.
Rising volume means fresh fuel arriving. Fading volume means exhaustion. It isn’t a crystal ball. It’s just the closest thing to ground truth a public chart offers.
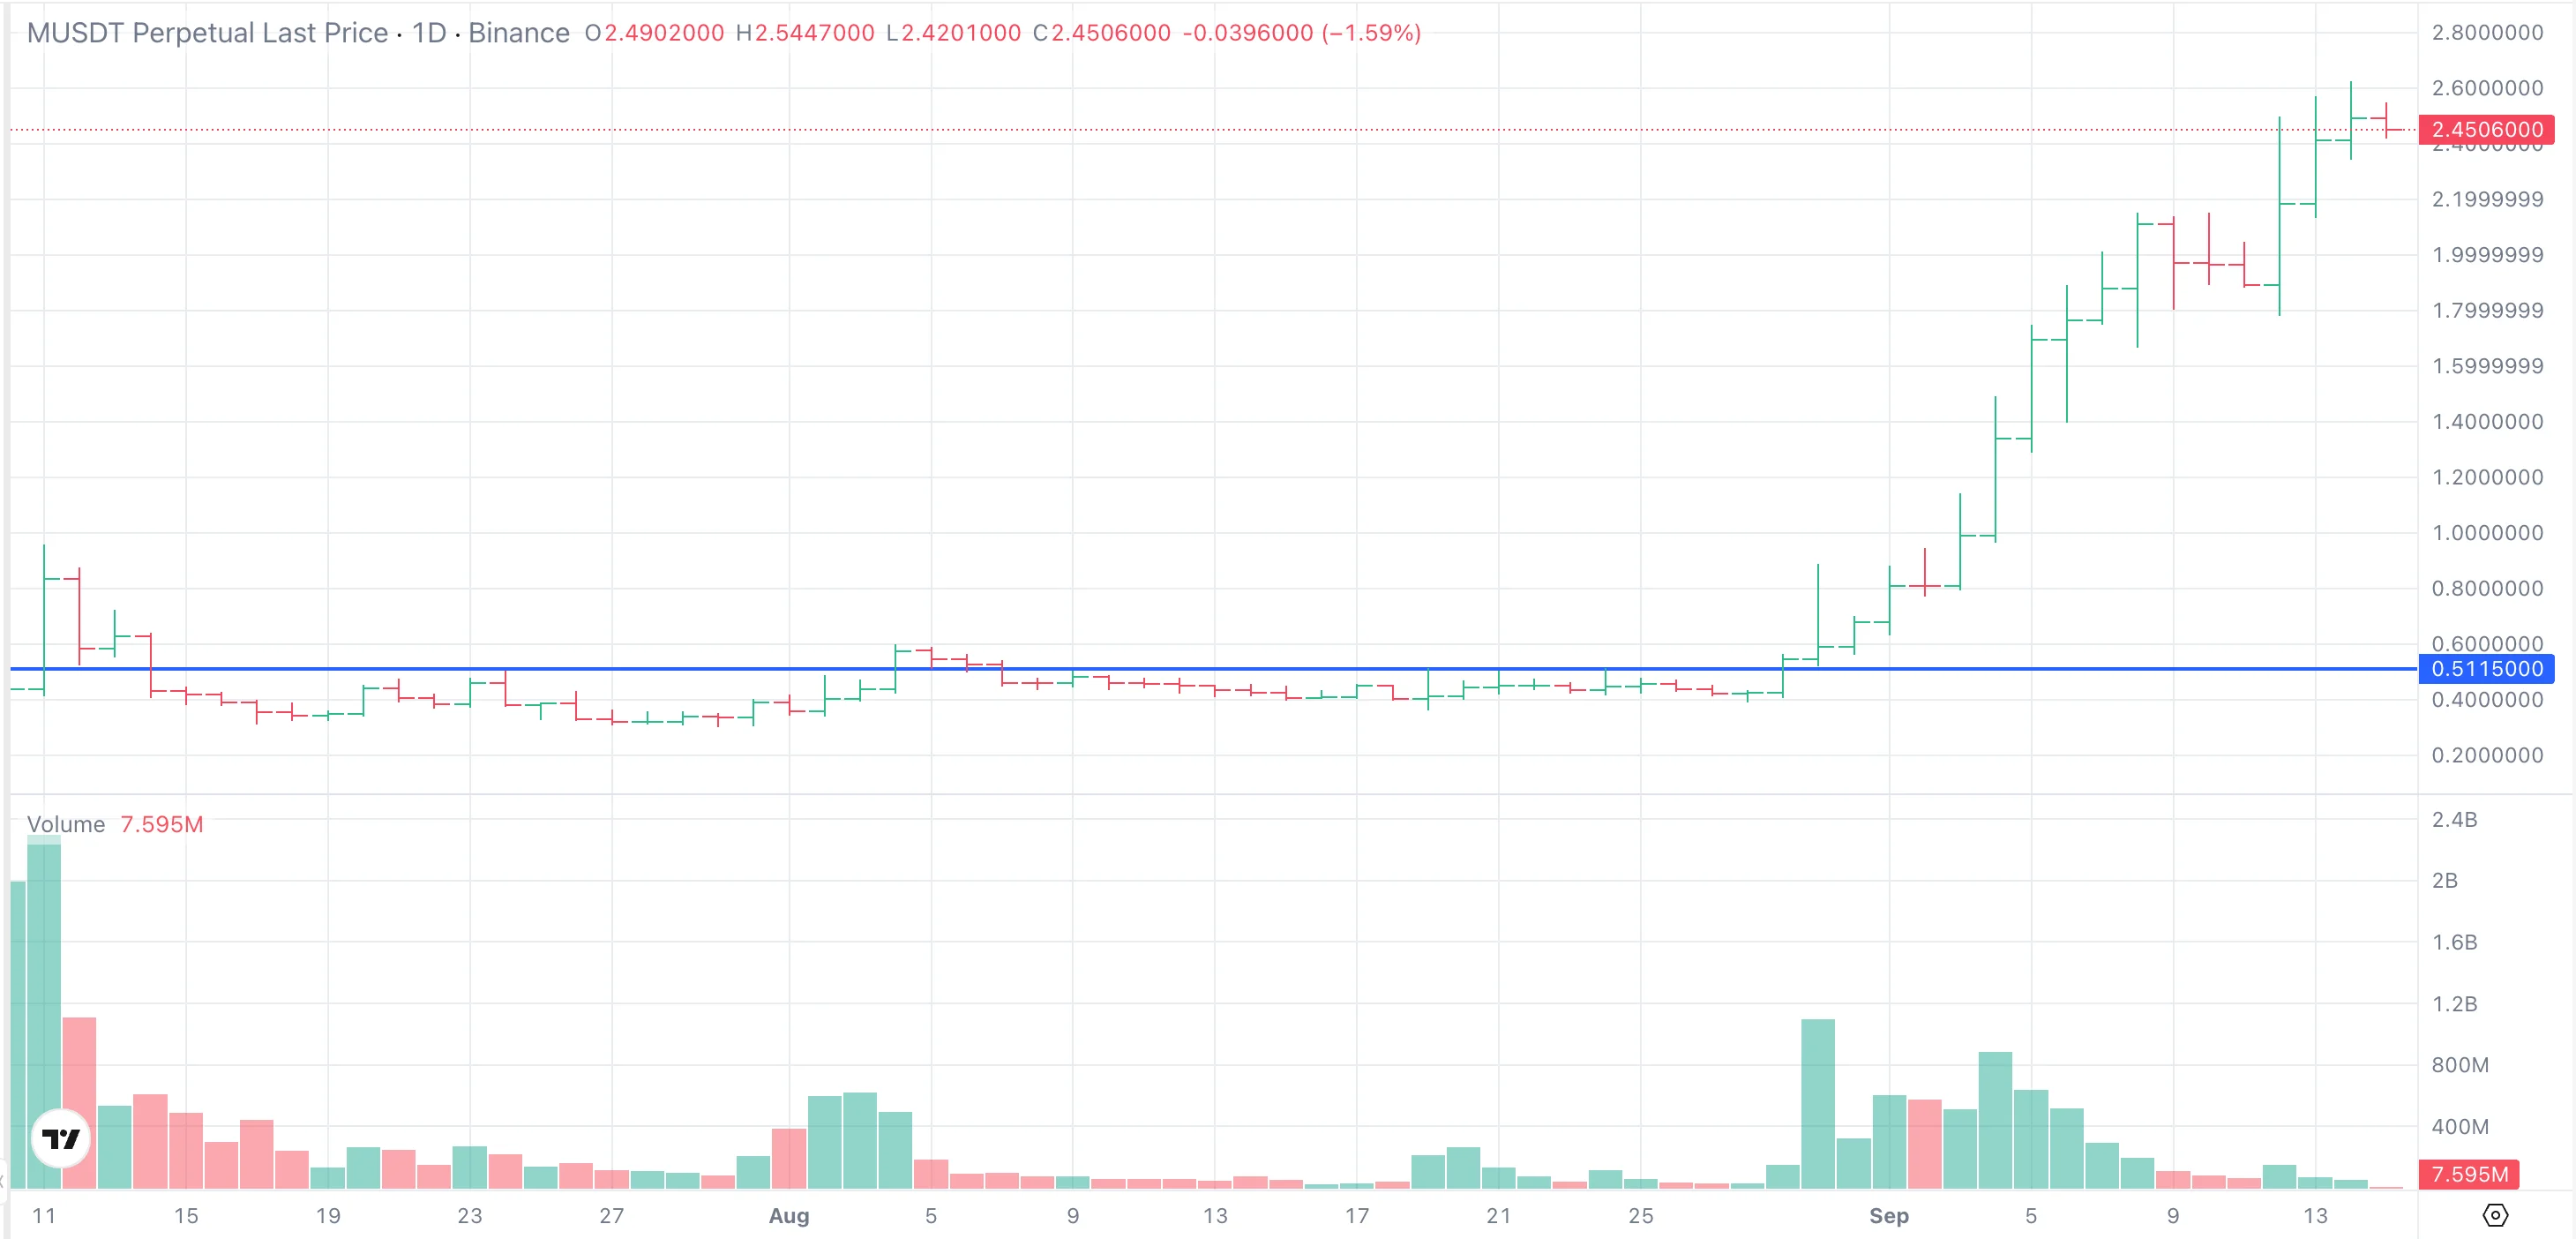
A breakout that showed its receipts
The chart above is a clean specimen (shown after the fact, as a case study — not a recommendation of anything). Price sat flat along one level for weeks. Then came the breakout — and volume didn’t just rise, it multiplied roughly ten times over its quiet baseline, and stayed elevated while the trend developed.
That is the footprint of a large participant. You can hide intent inside candles; you cannot hide that much money in the volume pane. The move wasn’t “random” — it was underwritten, and the volume was the receipt. This is the market’s non-randomness made measurable.
The two readings that matter
Everything practical about volume compresses into two situations:
- Rising volume on a move = conviction. New capital is joining, the move has fuel, continuation is the likelier path. This is what a real breakout looks like from the money side — the energy story told in a different pane.
- Fading volume after a big push = distribution. The participants who drove the move are handing off inventory, and the move is living on momentum rather than money. That’s when trends start dying quietly.
The same logic holds in crypto, stocks, or forex. The actors change; the accounting doesn’t.
Volume as the fakeout filter
Every chart has levels begging to be traded, and without a filter you’d take every fakeout on the menu. Volume is that filter.
Price rips above a level on thin volume? Nobody paid for that break — skip it, the trade belongs to someone else. Price stalls at a level but volume keeps building? Someone bigger is still working there, and the stall is loading, not failing — the squeeze picture, confirmed from the money side. A retest where volume holds is the strong kind; one where it evaporates is a stall in the making.
One more filter interacts here: volume follows the clock. A volume spike during the dead hours means far less than the same spike in the London–New York overlap, because the baseline it’s breaking from is thinner.
The part that stings
Sometimes the filter says no, and price goes anyway — without you. It stings. But the market never runs out of chances; there is always another setup forming somewhere, and tomorrow is another trading day. Missing one move on principle is cheap. Chasing unfunded noise is how accounts leak.
Volume isn’t flashy and it doesn’t trend on social media. It’s the whisper that says whether a move is alive or already dying. Trade without reading it, and you’re trading blind.
This article opens the “context” part of the series — the forces around a level that decide what a signal is worth. Tomorrow: the biggest context of all, the trend you’re inside of.
Reading the money flow behind every level it tracks is part of how ChartThread separates the setups worth your attention from the rest.