
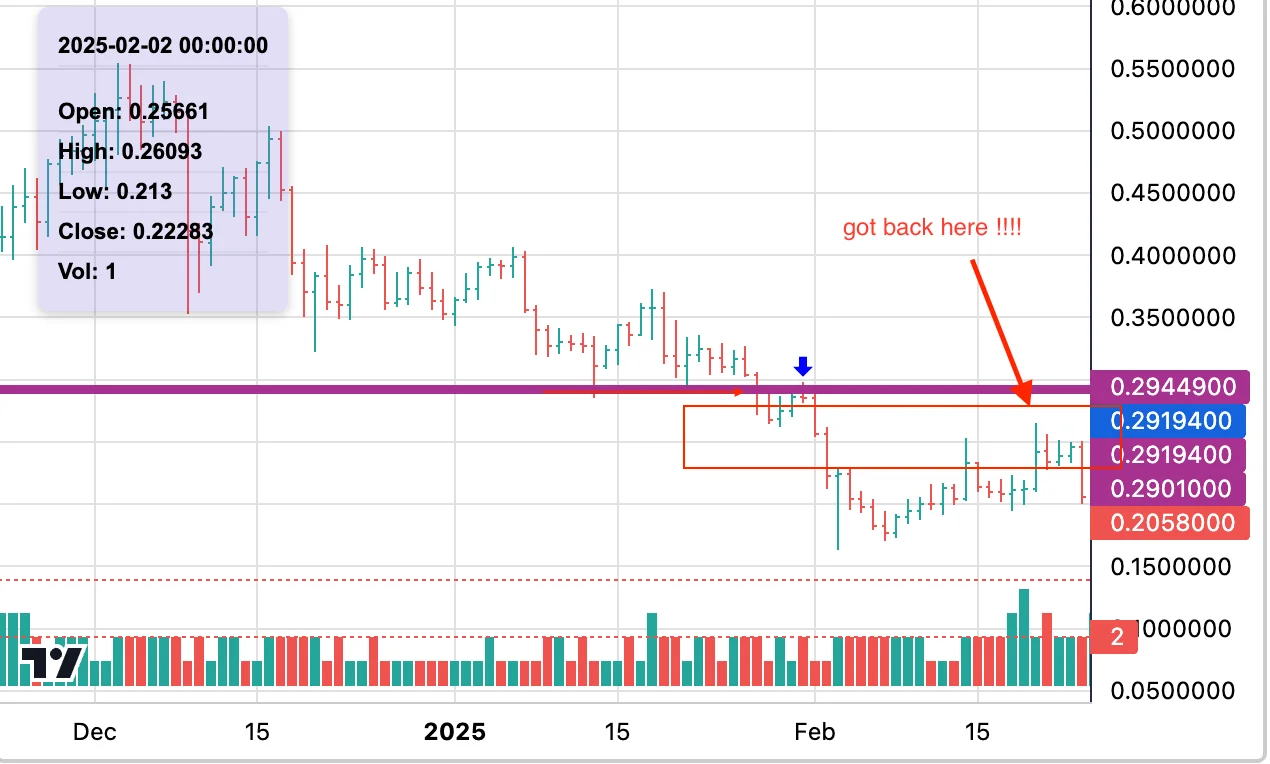
Sometimes you stare at a chart and feel that price has unfinished business. A clean jump from one level to another — no overlap, no backfill, a stretch of prices where almost nothing ever traded. That stretch is an imbalance: one side overwhelmed the other so completely that the market skipped the negotiation entirely.
The interesting property comes later. Open imbalances tend to act like magnets: price has a habit of coming back to them, sometimes sharply, sometimes weeks later. A zone the market skipped is a zone where business was left undone — orders unfilled, prices untested — and markets have a long memory for unfinished business.
Detecting one precisely
“A gap on the chart” is too vague to be useful, so here is the exact definition I built into my own scanner. Three candles:
1. The skip. If a candle’s high is below the low of the candle two positions later — or its low is above that candle’s high — the middle candle jumped a range without overlapping its neighbors. That’s the candidate imbalance:
if first.high < third.low or first.low > third.high:
    # potential imbalance between them
2. The size filter. Tiny gaps are noise the market never cares about. A meaningful imbalance has to span at least ~20% of the ATR — the day’s typical range:
if (zone.high - zone.low) >= 0.2 * atr[i]:
    # big enough to matter
3. The “still open” check. An imbalance counts only while it remains unfinished. Once price revisits the zone’s midpoint, the business is done and the magnet is spent:
mid = (zone.low + zone.high) / 2
open = not any(c.low <= mid <= c.high for c in later_candles)
Run that over a chart and you get a clean list of unresolved zones — context for every level nearby, and an explanation for some otherwise puzzling reversals: price wasn’t “randomly” returning to that spot; it was reacting to what it skipped.
The morning routine that makes it usable
Detection is the easy half. The value comes from a boring ritual I run every morning before touching anything else:
- Run the scan. One click; the script sweeps every instrument and lists open imbalances — symbols and dates, no noise.
- Clean the list. Add today’s new cases. Remove yesterday’s fakes — not every candidate survives daylight. Keep yesterday’s valid zones if they still haven’t filled.
- Keep a shortlist. A handful of instruments worth attention, instead of monitoring everything. The zones institutions actually left behind are few.
The strategy on top is deliberately primitive: watch how price behaves when it returns to an open zone, in the context of the levels and volume around it. Repetitive, boring — and that’s the point.
The honest part
Here’s what a single blog post can’t transfer: the routine is the skeleton, but the flesh on it is pattern recognition from years of watching markets tick by tick. Call it screen-time edge. After thousands of charts, the brain spots small tells that resist being written down. Copying the three code snippets above won’t replace that — the scan tells you where to look, and experience tells you what you’re looking at.
But that’s exactly why the ritual matters. The edge isn’t the script. The edge is doing the homework every single morning, without fail, so that when one of those zones starts resolving, you’re already watching it.
Automated, always-on watching of the zones that matter is the entire reason ChartThread exists — the homework, without the 6 a.m. script launch.