
Some traders look at charts. I look at energy — not the mystical kind, but a number: how much range this market can realistically cover today. That number is ATR, the Average True Range, and treated correctly it works like a battery indicator. It tells you how much is left in the tank, and therefore how far any idea about “price breaking that level” can actually go.
The rule of thumb that makes it useful: most instruments respect their ATR about 80% of the time. Once price has covered most of its typical daily range, it is unlikely to break new levels that day unless something extraordinary happens. This is the measurable core of the exhaustion story this series keeps returning to — “the tank is empty” isn’t a metaphor, it’s a reading.
What ATR actually measures
ATR, introduced by J. Welles Wilder, averages the true range of each period — the greatest of: the high minus the low; the distance from the previous close up to the high; the distance from the previous close down to the low. That last pair matters because it counts gaps: it measures how far the market actually traveled, not just how tall the candle looks.
How a day’s range is built
Here’s the part almost nobody checks. I once analyzed a full year of every crypto pair on Binance, asking a simple question: how many hourly ATRs, and how many 5-minute ATRs, fit inside one daily ATR?
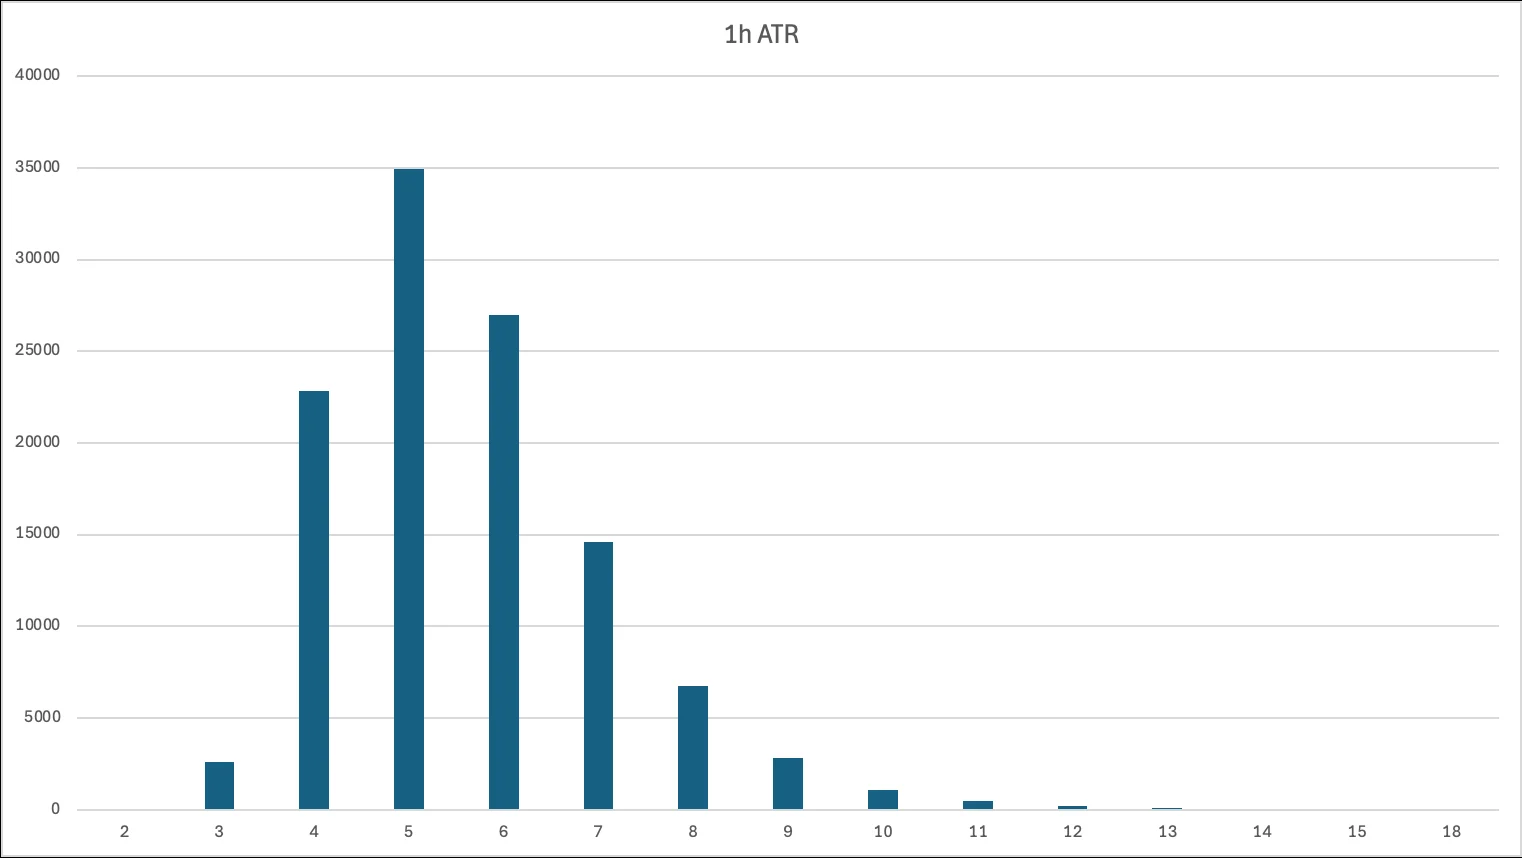
The answer is remarkably stable. The daily range is built from about five hourly ranges, with the distribution peaking hard at 5 and almost everything falling between 4 and 7. On the 5-minute scale:
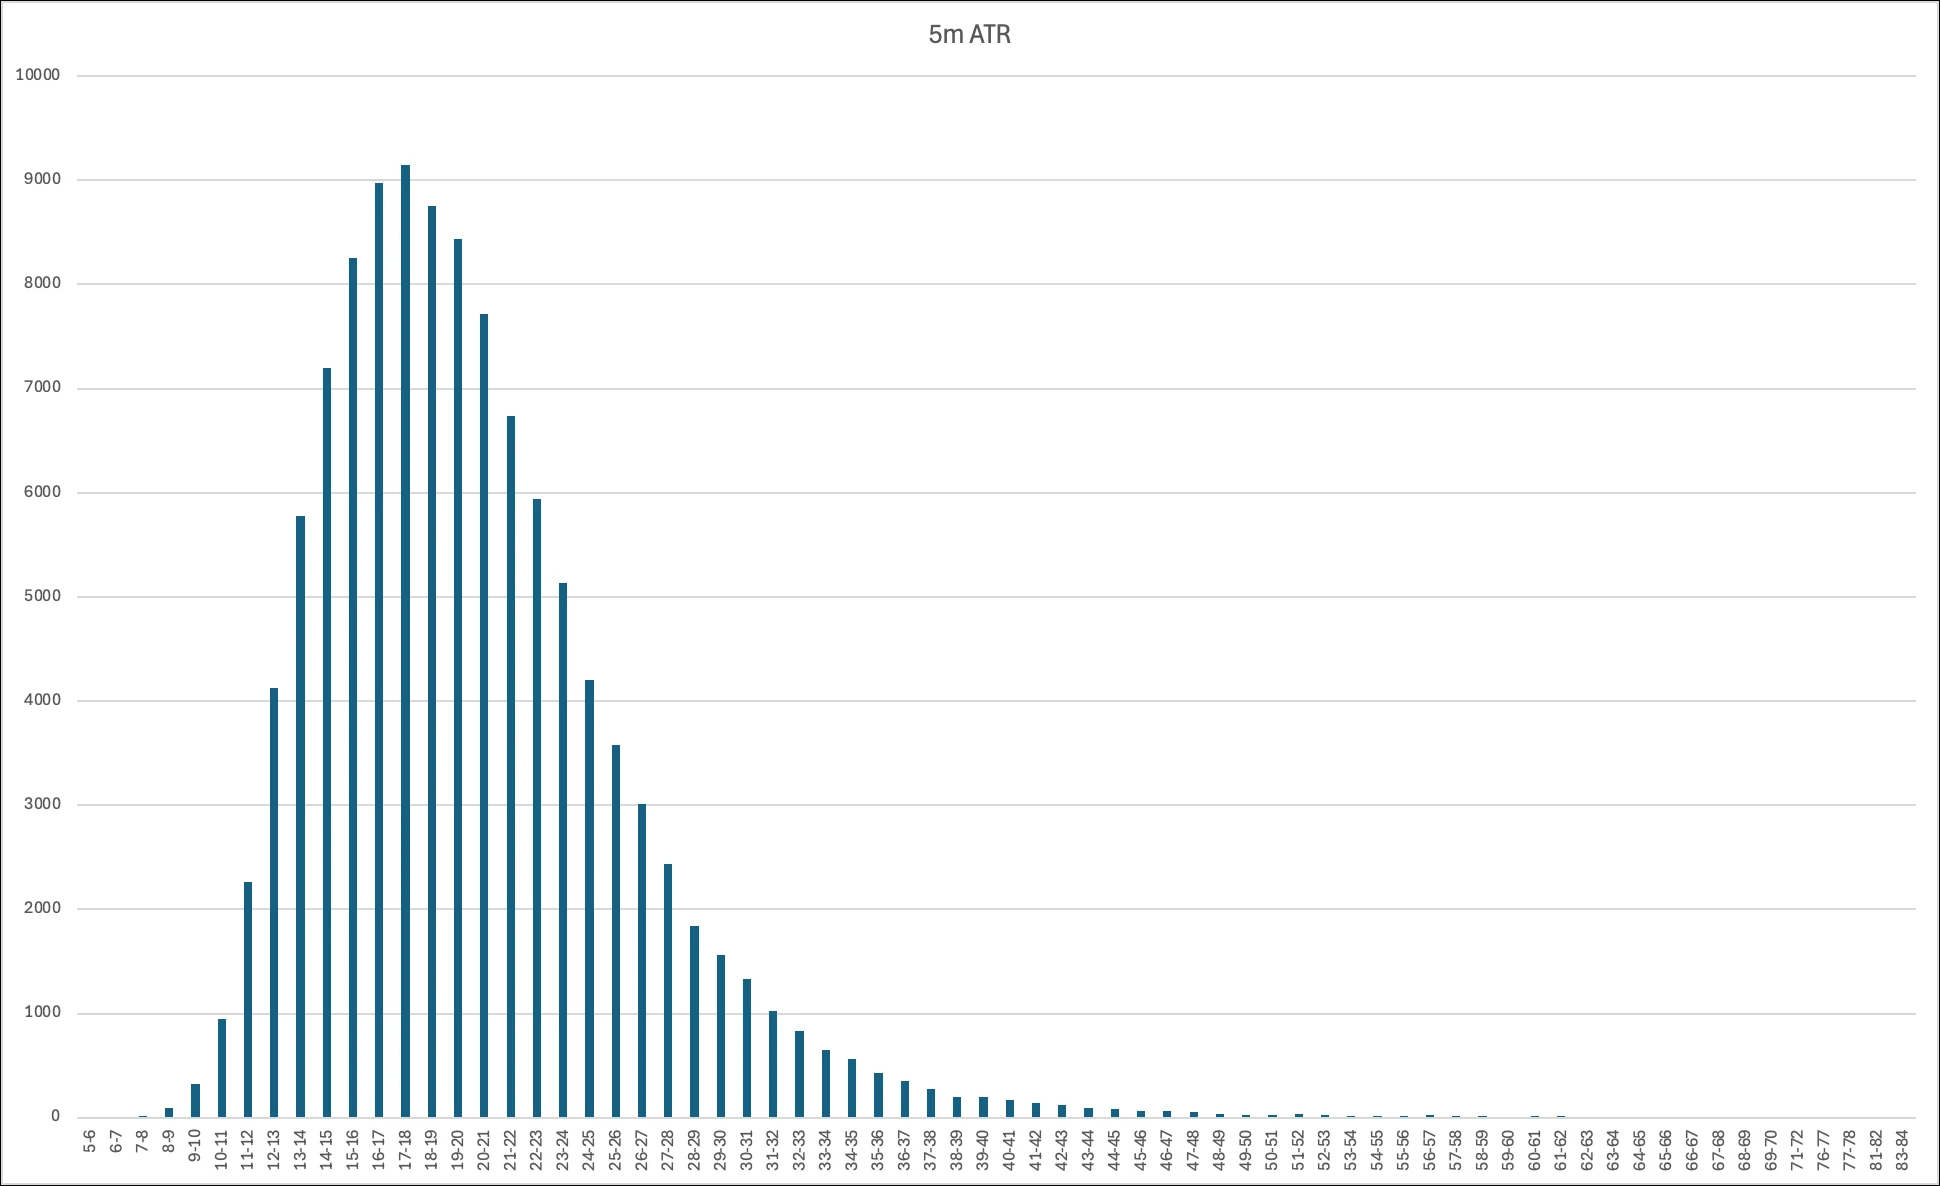
around 17 five-minute ranges make up a day, and readings above 30 or below 10 are rare. Daily volatility isn’t random — it’s an assembly of smaller, countable pieces.
This gives you a live fuel gauge. If the hourly and 5-minute ranges are already running hot relative to their averages, much of the day’s fuel is spent — expect less room for big moves, and be suspicious of any breakout attempt. If the smaller frames are tight and compressed, the day still has range in reserve — the squeeze picture with a number attached.
Computing an ATR you can trust
The default 14-period ATR from a platform’s indicator menu is fine for textbooks. Building trading algorithms since 2020, I ended up with something stricter: a 5-period ATR with hygiene rules, because a fuel gauge polluted by outliers is worse than none.
The logic, in brief:
- Compute the true range for each of the last several candles.
- Remove outliers — one-off spike candles that would inflate the average.
- Remove dead candles — flat, no-energy bars that would deflate it.
- If fewer than three “normal” candles survive the filtering — there is no valid reading today. Average what remains only when the sample is coherent.
stable_atr(candles, window=5):
    tr[i] = max(high[i]-low[i], |high[i]-close[i-1]|, |low[i]-close[i-1]|)
    last  = tr for the most recent `window` candles
    drop values > 2 × min(last)                # spike outliers
    keep values within 0.5–1.5 × median(last)  # stability band
    return average(kept) if count(kept) >= 3 else None
That None branch is the point of the whole design. If the recent candles are too chaotic to produce a stable ATR, the instrument has no rhythm today — the energy is fragmented, and any range-based reasoning about it is fiction. No stable ATR, no read.
What the gauge changes in practice
- Distance checks become honest. A level within one remaining daily ATR is in play; a level two spent-tanks away is scenery — the seventh level filter, now with a proper gauge behind it.
- Exhausted approaches get flagged before the trap. A V-shaped sprint that has already consumed the day’s range arriving at resistance is the textbook false-break setup, and the ATR math says so in advance.
- Quiet compression becomes visible. Low spent-range plus building volume near a level is stored energy you can quantify.
The market’s energy isn’t infinite, and it isn’t hidden either. It’s measurable — you just have to read the gauge before believing the chart.
Tracking levels together with the volatility left to reach them is part of how ChartThread decides what’s worth showing you.