How to draw a level, step by step
A chart has a turn every few days. Draw a line at each one and you get a cage of lines that tells you nothing. A level is drawn only where something important happened.
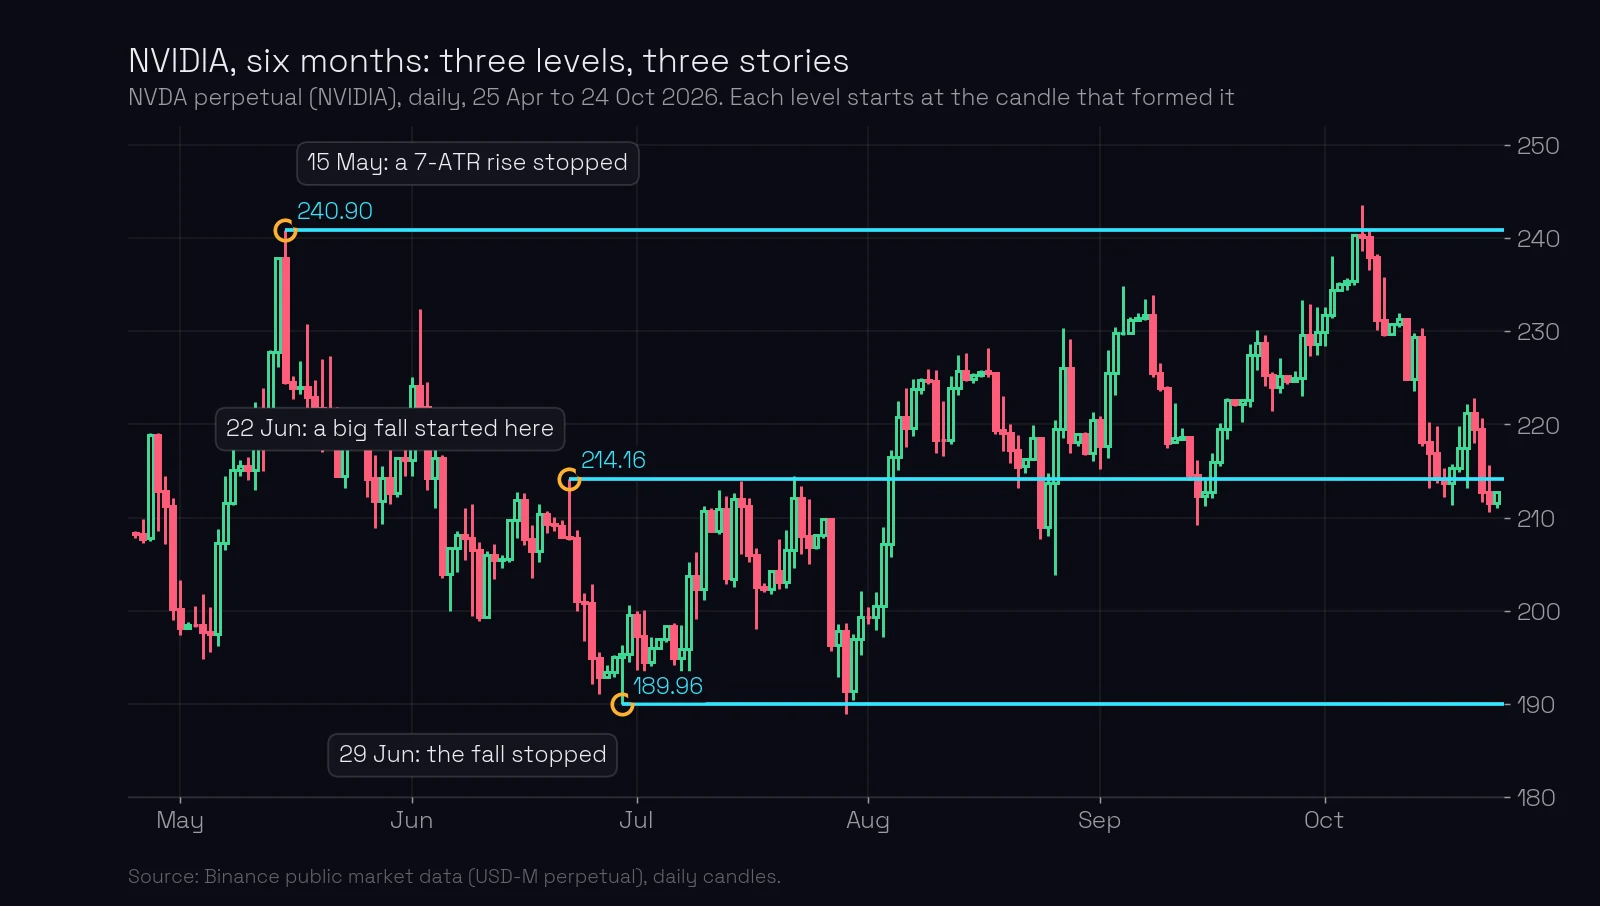
This lesson draws levels on six months of NVIDIA’s daily chart, one step at a time. At the end there are three levels, each with a story you can say out loud.
What you’ll learn
- The six steps from a blank chart to usable levels.
- Which events make a level, and which turns to skip.
- Why a level is drawn from its candle to the right, never back from today.
- What to check before you trust a level you drew.
Step 1: open the daily chart, six months back
Levels come from the daily chart (the reasons are in why levels come from the daily chart). Six months of history is usually enough to find them. If price is somewhere it has not been for six months, look further back on the weekly or monthly chart.
Use candles or bars, the plain price chart, and nothing on top of it: no indicators, no moving averages. You are looking for what price did, not for a calculation.
Step 2: find the important events
A level shows an important historical event on the chart. Look for these:
- A big move stopped. Price rose or fell for days and was stopped at one price.
- A big move started. Price left a price fast and did not come back.
- A repeated high or low. Price came back to the same high or low and turned again.
- The first stop after a big move. After a long run, the first place price paused.
On NVIDIA three events stand out. On 15 May a rise of about 7 times the daily average true range (ATR) stopped at 240.90, and the same day price closed 16 dollars lower. On 22 June a fall started at 214.16. On 29 June that fall stopped at 189.96.
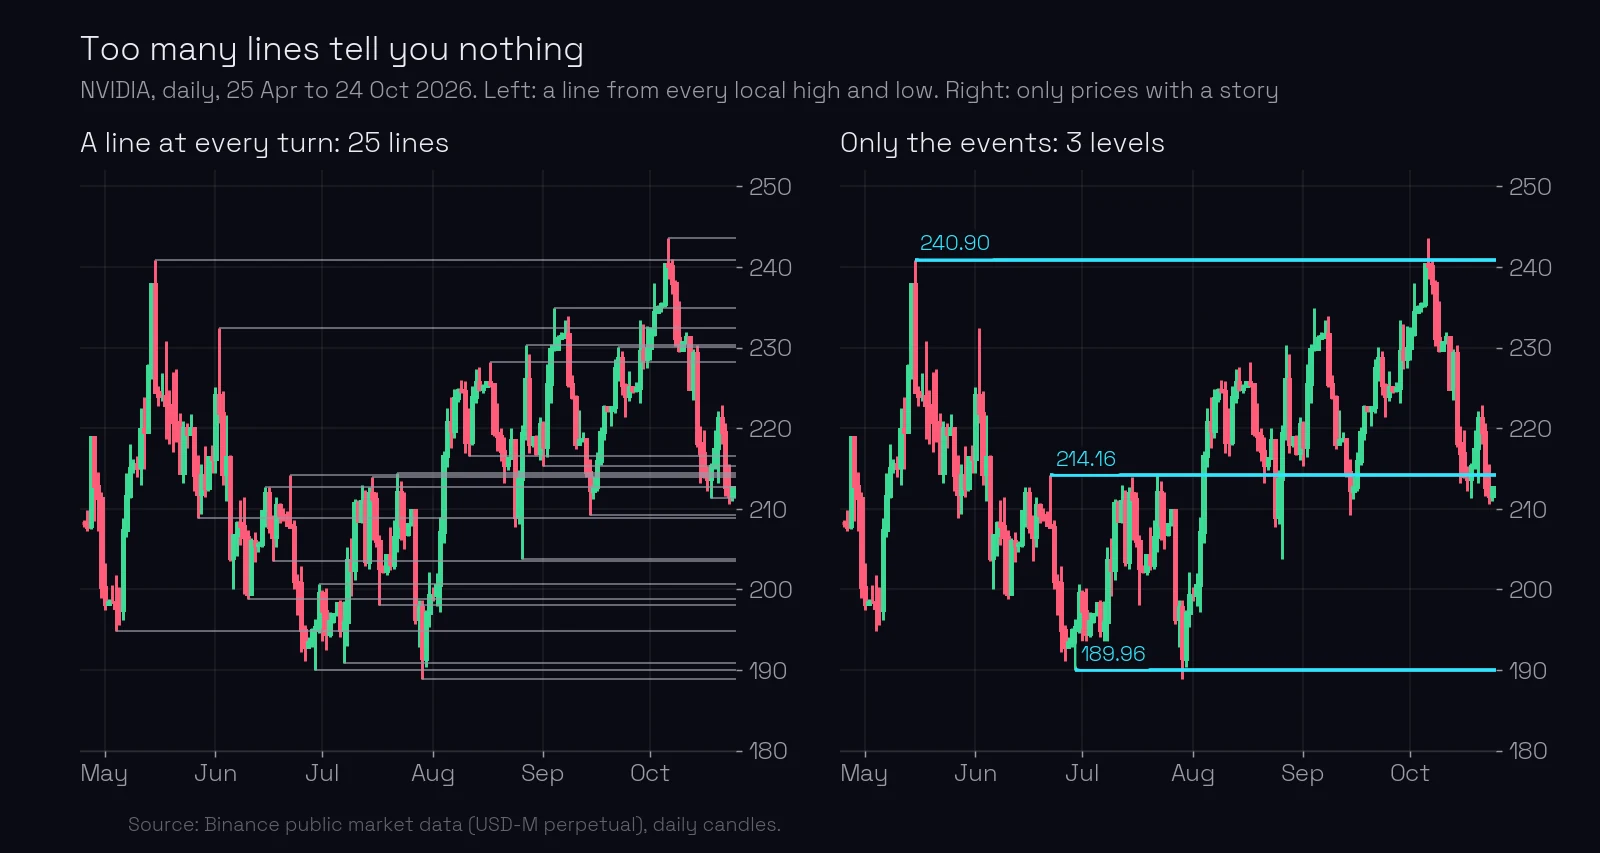
Everything else is a turn without a story. NVIDIA made 25 local highs and lows in these six months. A line at each of them is noise: price will “react” to some line every day, and you will not know which one matters.
Step 3: find the candle that formed the level
Every level has its own candle: the bar that formed the level. Find it and read its exact price. A level is the high or the low of that candle, never its open, close or body (see zones vs levels).
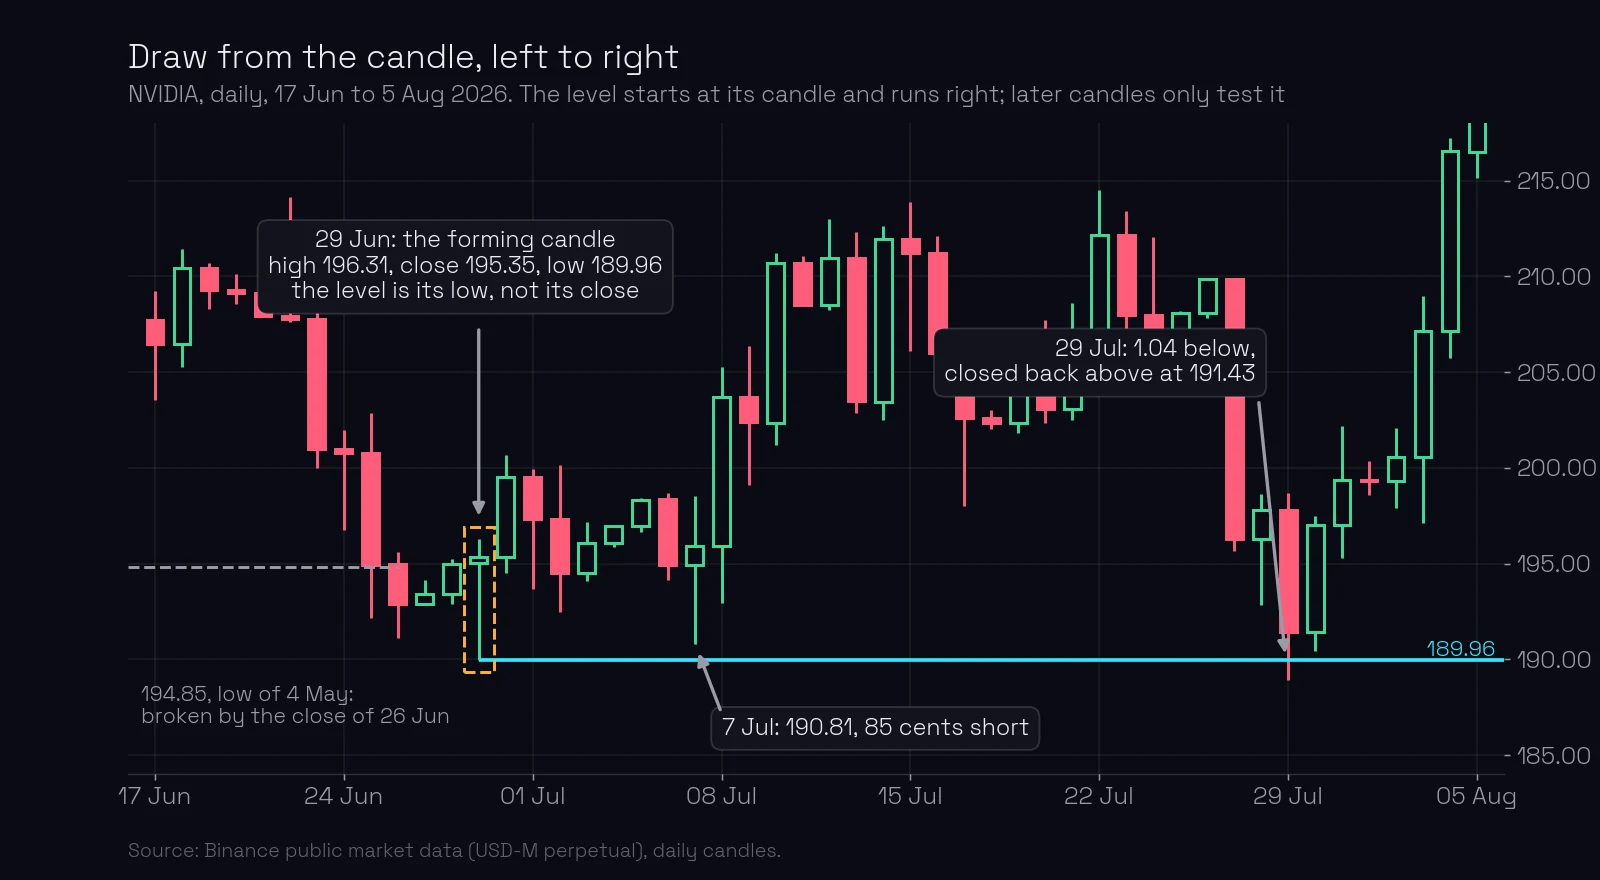
On 29 June NVIDIA traded between 196.31 and 189.96 and closed at 195.35. The level is 189.96, the low. The close, 195.35, is only where the day ended.
More on finding this candle, and on the candles that look like it but are not, in the candle that forms a level.
Step 4: draw from the candle to the right
A level is drawn from left to right. Start the line at the candle that formed it and extend it into the future.
Do not do it the other way round: do not start from today’s price and look left for a place where a line “fits”. And do not look for confirmations to the right of the candle before you draw. The event is the reason for the level. What price does later is a test of the level, not the reason for it.
On the chart above, the line starts on 29 June. Eight days later, on 7 July, price came down and stopped at 190.81, 85 cents short of the level (the daily ATR was 4.97). On 29 July it went 1.04 below the level and closed back above at 191.43. These were tests, and the level passed both. On 4 August NVIDIA closed above 214.
Step 5: keep the chart clean
A chart full of lines is as useless as an empty one. Three habits keep it readable:
- Start near today’s price and work back. Draw the levels closest to where price is now first, then move back to older ones. Add an older level only when it is a strong one, with clear visual strength in the history you can see.
- Never draw levels close to each other. Two levels close together mean you do not know which one matters. Keep one.
- Two levels are enough: one above price, one below. Price sits between them, and that is all you need to read the chart.
- A good level splits the chart into clear zones. Look at the chart with the line on it: price lived on one side of the level, then on the other, and the line separates the two areas visually. A line that cuts through the middle of busy price action, with candles all around it, splits nothing.
On NVIDIA, working back from today’s price also removes old lines that no longer count. The low of 4 May, 194.85, started the rise to 240.90, but on 26 June price closed below it, and three days later a new fall stopped at 189.96, about one daily ATR lower. A broken level is not used, so 189.96 is the level, and 194.85 is not drawn.
Step 6: check what price did at the level since
Before you use a level, look at how price behaved there after it formed.
- Tests that held keep the level working: exact touches, near misses, shallow false breakouts that close back. NVIDIA’s 240.90 is an example: on 6 October price went 2.67 above it and closed back below, at 240.14, then fell to 229.46 in three days.
- A level crossed again and again, with closes on both sides, is sawed through. NVIDIA’s 214.16 held twice in July. Since August price has crossed it on 15 days and closed on both sides of it. It was drawn correctly, and there is nothing wrong with it, but today nobody defends that price. It cannot be used until it is confirmed again (more in sawed-through levels).
Example: NVIDIA’s levels on 24 October 2026
The six steps leave three levels, each with a story:
| Level | Candle | Story | Since then |
|---|---|---|---|
| 240.90 | 15 May, high | A 7-ATR rise stopped | Shallow false breakout on 6 October, then a fall |
| 214.16 | 22 June, high | A big fall started | Held in July, sawed through since August |
| 189.96 | 29 June, low | The fall stopped | Held twice in July, then a rise of 28% to 243.57 |
Price closed at 211.59 on 23 October. Of these three levels, two are usable and one is used up. The chart you keep has two lines: 189.96 below price and 240.90 above it, with price in between.
What most traders miss. There are many theoretically correct levels, but not every level can be used. Drawing is half of the job. The other half is the check in step 6: a level that was right in July can be sawed through by October. You did nothing wrong when that happens. You just stop using it until price confirms it again.
Common mistakes
- A line at every turn. Twenty-five lines hide the three that matter. Fix: draw only where you can name the event.
- Drawing from right to left. Starting at today’s price and searching for a “fit” finds lines everywhere. Fix: start at the event and draw to the right.
- Taking the close or the body. Fix: the exact high or low of the candle that formed the level.
- Too many lines, or two levels a dollar apart. Fix: keep one level above price and one below, start from the closest, and never draw two levels close together.
- Trusting a level without checking it. Fix: look at every crossing since the level formed; sawed-through levels are out until confirmed.
Key takeaways
- Work on the daily chart, about six months back; go to weekly or monthly when there is no history at the price.
- Draw only important events: a big move stopped, a big move started, a repeated high or low, the first stop after a big move.
- A level is the exact high or low of the candle that formed it, drawn from that candle to the right.
- Start near today’s price and work back; never draw levels close to each other; keep one level above price and one below.
- Check each level since it formed: many correct levels, few usable ones.
Lesson test · 8 questions
Check yourself
Can you pass on the first try?
Passing the test completes this lesson. Tests in a module open in order, each after the one before it. A first-try pass scores 100%. Each wrong answer costs 10 points, and every 10 wrong answers lock the test for 30 minutes. Once you pass, your score is final, except that a score of 50 or less can be retaken once.
-
Which chart do you start from when you draw levels?
-
Which of these is a reason to draw a level?
-
NVIDIA made 25 local highs and lows in six months. How many of them should become levels?
-
The candle that formed a level traded from 196.31 to 189.96 and closed at 195.35. Where is the level?
-
How is a level drawn?
-
An old low at 194.85 is broken by a daily close, and three days later a fall stops at 189.96. Which level do you keep?
-
A level held twice in July; since August price crossed it on 15 days and closed on both sides. What do you do?
-
Price is at 211.59. You have drawn levels at 240.90 above and 189.96 below. What makes a clean chart?
Free account
Take the test and keep your score
- Your answers are checked and every lesson you pass is marked complete.
- Your scores build into your course score, on any device.
- You come straight back to this question after signing up.
Next: why levels come from the daily chart. To compare your levels with ChartThread’s, open NVIDIA on the levels page.
Terms in this lesson
Educational content, not financial advice. Trading carries a risk of loss.