Best timeframe for support and resistance: the daily chart
Levels are always taken from the daily chart. The weekly and monthly charts add older levels. The hourly and minute charts never make a level of their own.
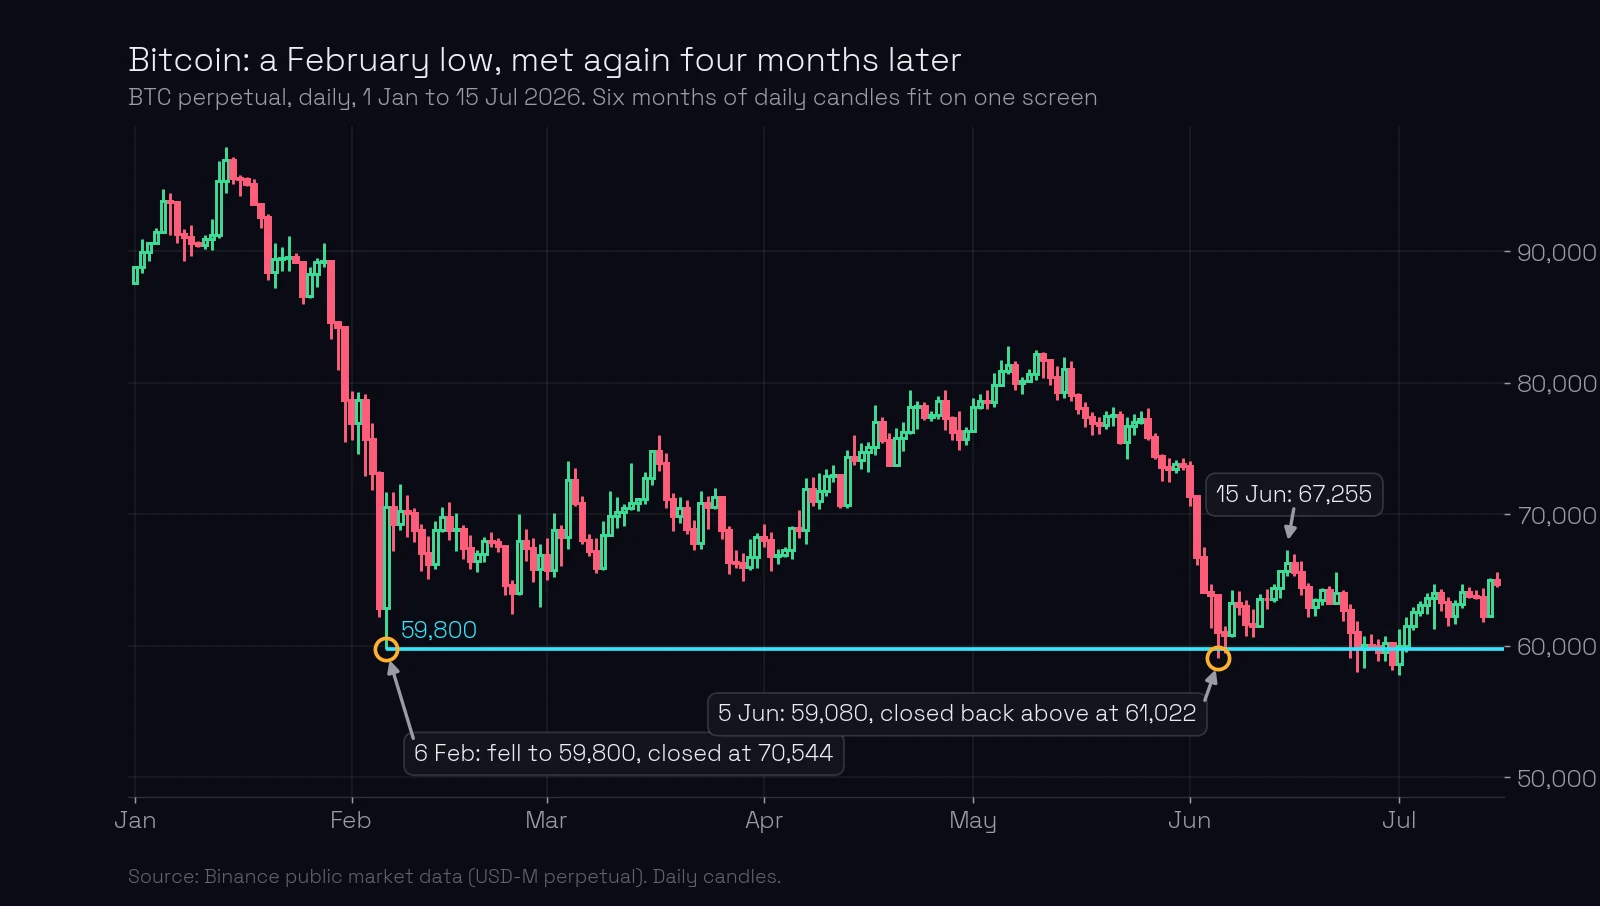
On 5 June 2026 Bitcoin fell to 59,080 and closed back above 61,000. The price that stopped it was set four months earlier, on 6 February. On the daily chart both days fit on one screen. On an hourly chart they are about 2,860 candles apart.
What you’ll learn
- Which timeframe support and resistance levels come from, and why.
- What the 4-hour, 1-hour and 5-minute charts are for, if not for levels.
- How far back to look, and when the weekly or monthly chart takes over.
- Which levels you have when price is at a new high or low.
Which timeframe shows support and resistance levels?
The daily chart. A level is a price where something important happened, and to find it you need to see the history at that price. Six months of daily candles is about 180 candles, which fit on one screen. The same six months is 4,392 hourly candles or 52,704 five-minute candles. Nobody scrolls through that.
The Bitcoin chart above shows why it matters. On 6 February an abnormal candle fell to 59,800 and closed at 70,544, almost 11,000 higher. Selling of that size was bought at 59,800. Four months later price came back, went 720 below that low (less than a third of the daily ATR, which was 2,426) and closed back above it: a false breakout. Ten days later Bitcoin was at 67,255.
A trader looking at the last few days on an hourly chart would not even know the price 59,800 existed.
Later in June price crossed 59,800 again and again, with closes on both sides, and the level was sawed through. A daily level is not forever. It is the right place to look.
Why a daily turn matters and an hourly turn does not
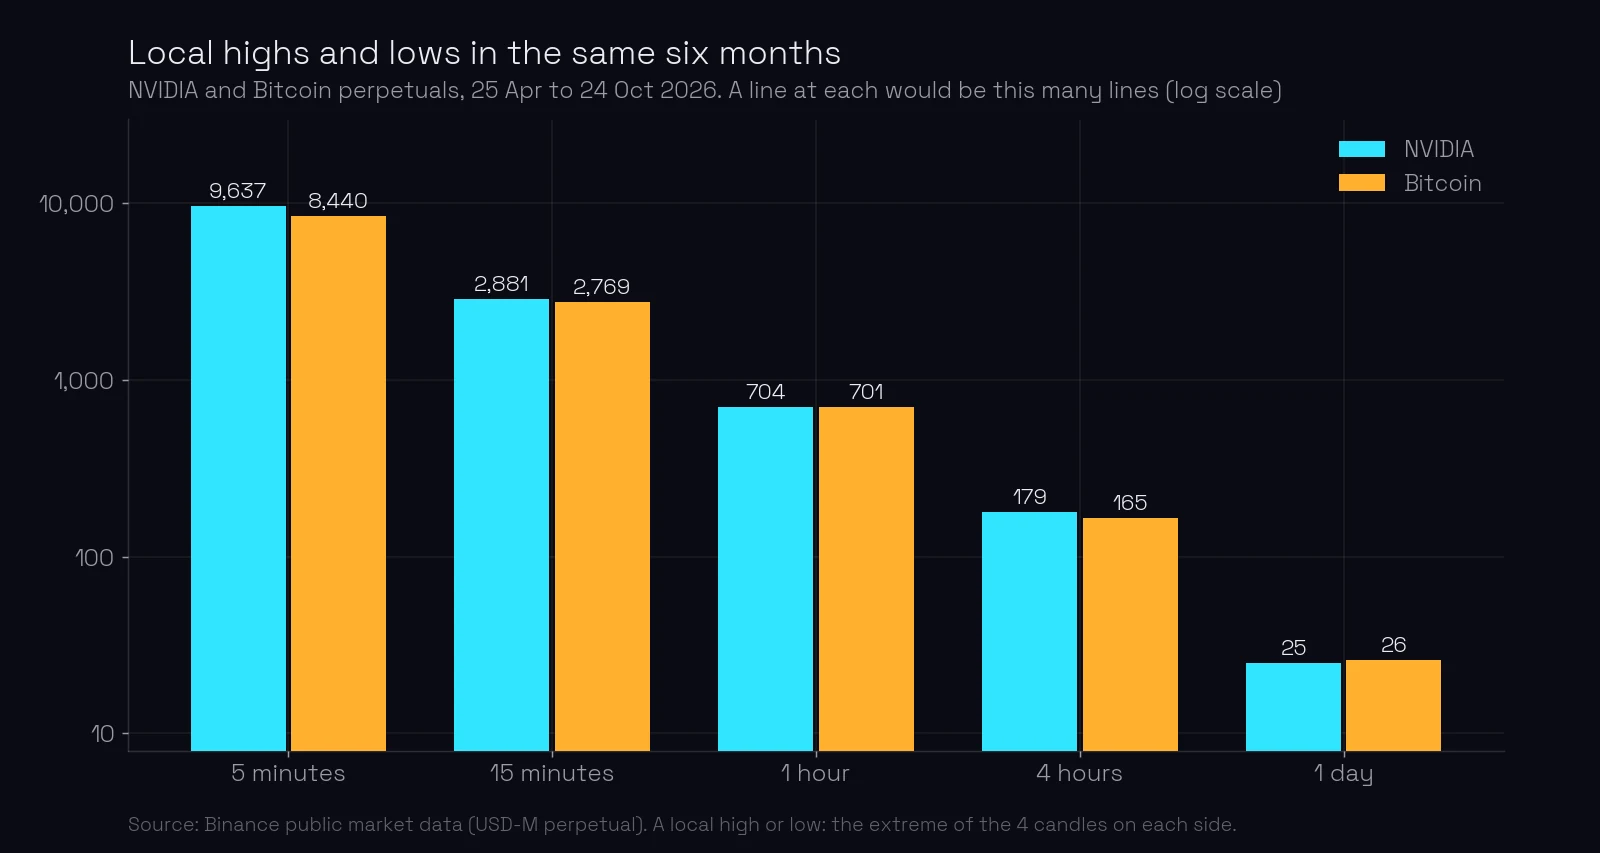
Count the turns. Over the same six months, NVIDIA’s contract made 25 local highs and lows on the daily chart, 704 on the hourly chart and 9,637 on the 5-minute chart. Bitcoin, a very different instrument, gives almost the same numbers: 26, 701 and 8,440.
Each turn is a place where someone could draw a line. On the daily chart, a few of the 25 have an event behind them and become levels (how to draw a level). On the hourly chart, 704 lines would mean a “level” every few cents, and price would be touching one of them all the time.
A daily high or low is also seen by everybody. A trader on a 5-minute chart, a trader on a daily chart and a fund on a weekly chart all see yesterday’s high. A 5-minute turn is invisible to all of them except the person looking at it. A level works because many players act at the same price, so it has to be a price they all see.
What are the lower timeframes for?
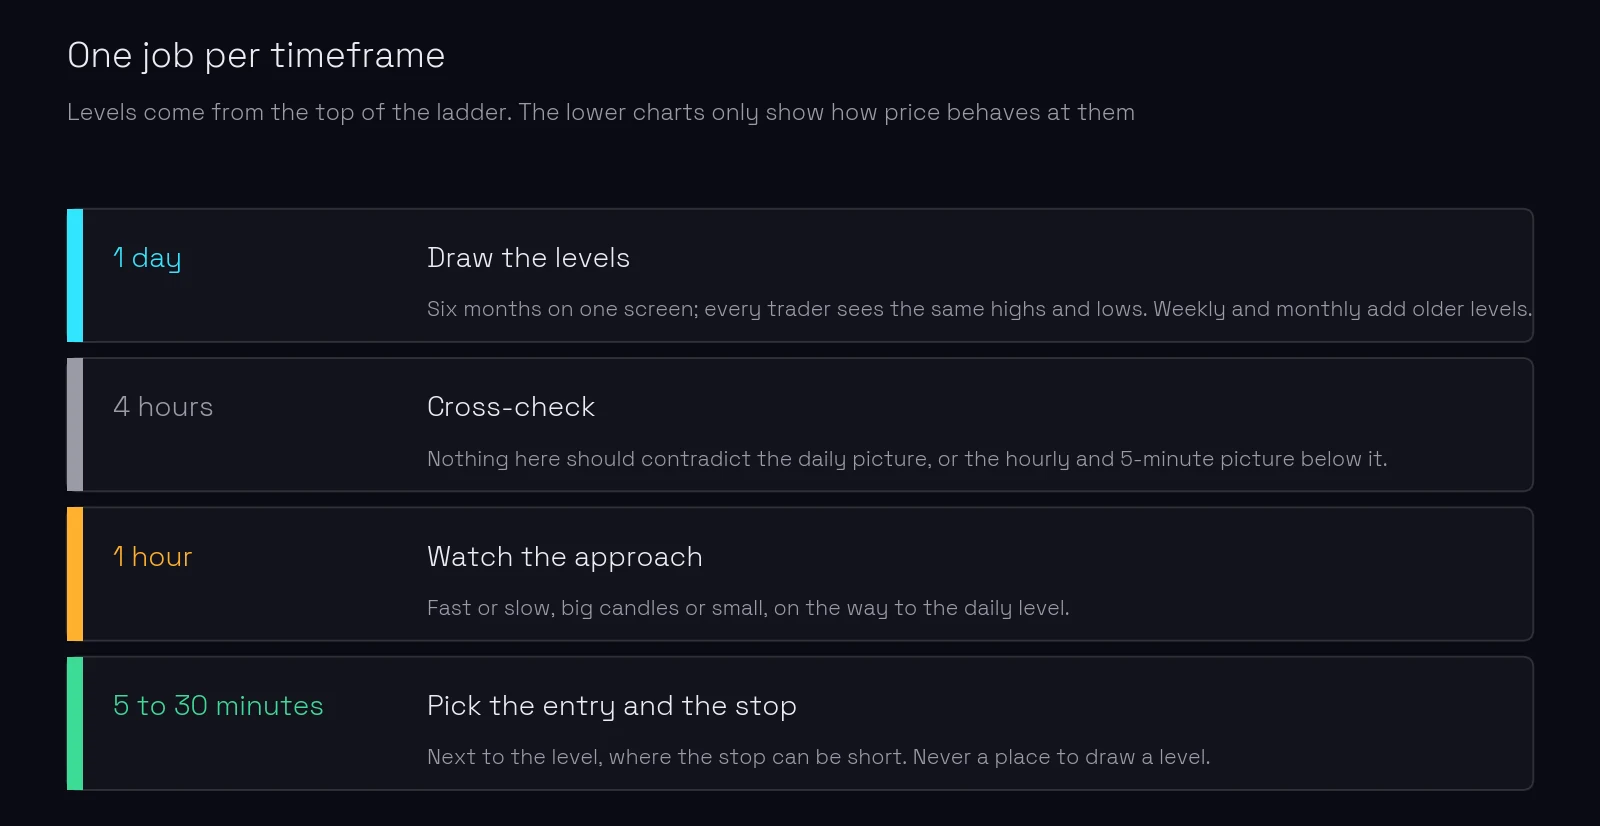
Each timeframe has one job (timeframes explained):
- The daily chart draws the levels.
- The 4-hour chart is a cross-check. Nothing on it should contradict what the daily chart shows, or what the hourly and 5-minute charts show below it.
- The 1-hour chart shows how price approaches a daily level: fast or slow, on big candles or small.
- The 5, 15 or 30-minute chart is where you choose the entry point next to the level and place a short stop (the point of entry).
The charts must agree. If the daily chart says a level is about to break, but the 4-hour or the hourly chart shows price being pushed away from it, there is no trade. Charts on different timeframes should never contradict each other for a trade.
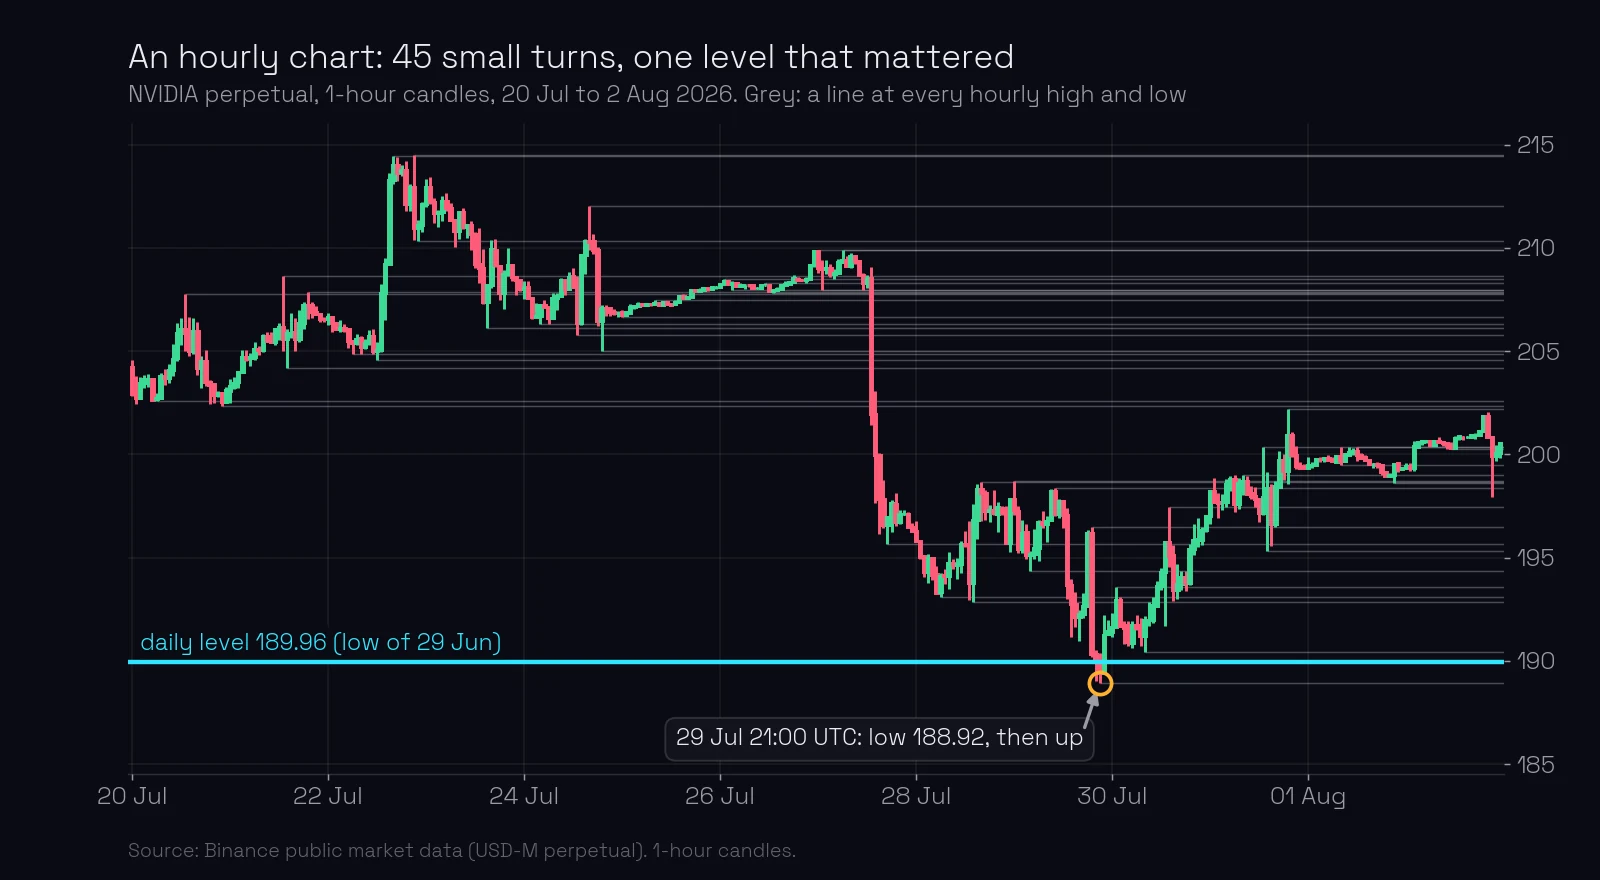
The hourly chart above covers two weeks of NVIDIA. It has 45 small turns, shown as grey lines. The fall of 27 to 29 July went through several of them without stopping. It stopped at one price: 189.96, the daily level from 29 June. At 21:00 UTC on 29 July price went to 188.92, closed the day back above the level, and turned up. The hourly chart showed the approach. The level came from the daily chart.
How far back should you look for levels?
Six months of the daily chart is usually enough to find the levels around today’s price. When there is no history at this price in six months, switch to the weekly or monthly chart. They show years on one screen, and an old level found there is still a level (historical levels).
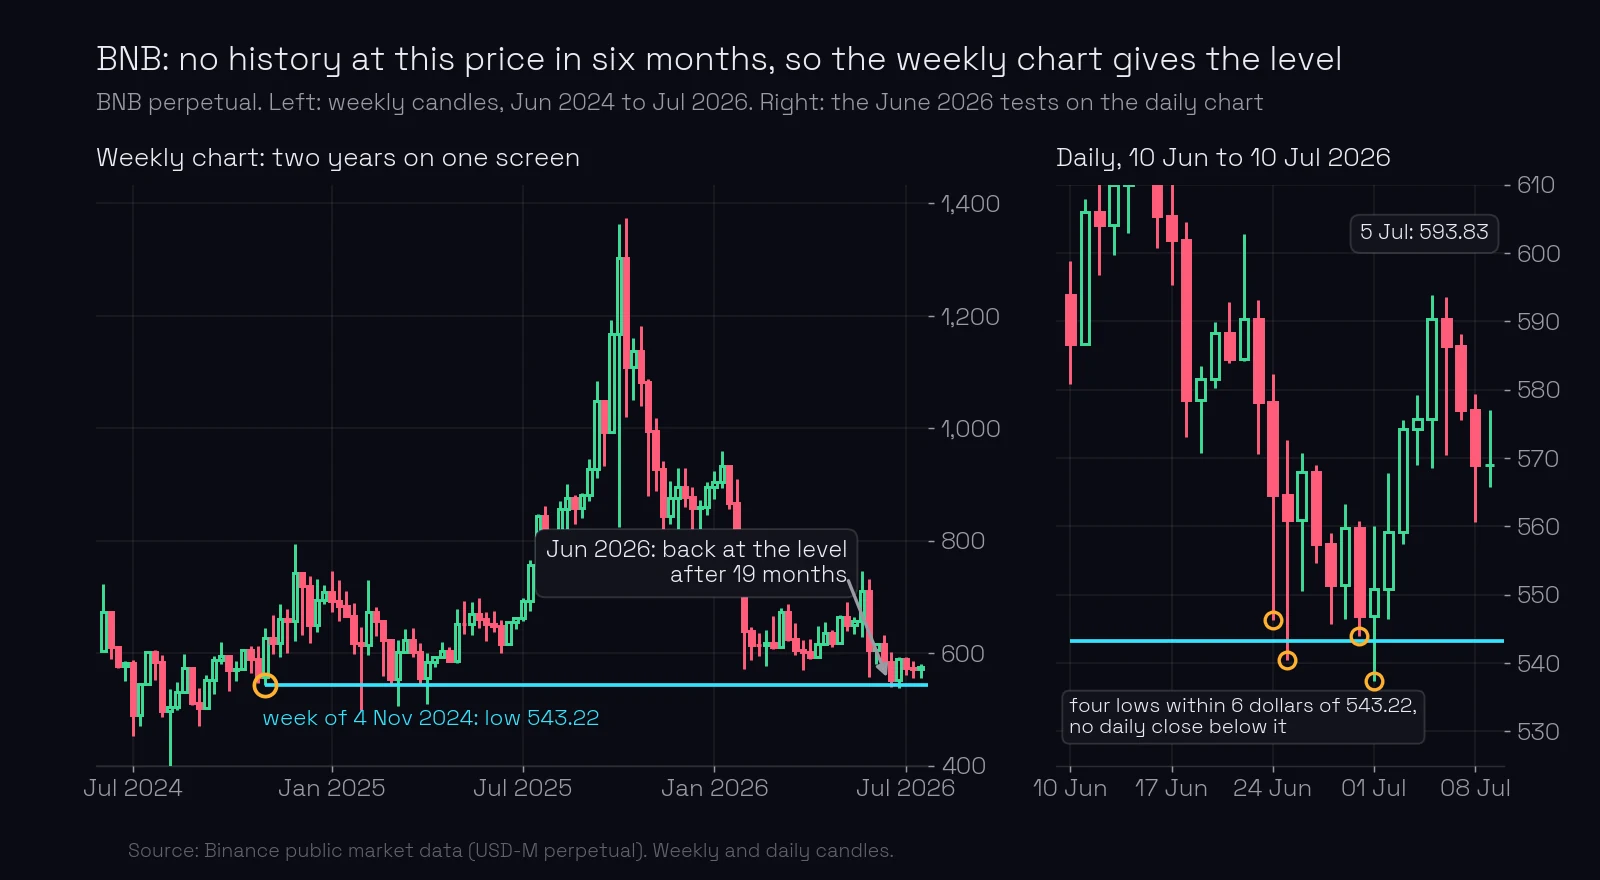
BNB’s contract in June 2026 is the case. On 24 June price fell to 546.32. In the previous six months no daily candle had been below 556.88, so the daily chart had nothing to say about this price. The weekly chart had: in the week of 4 November 2024, nineteen months earlier, BNB fell to 543.22 and closed that week at 627.84, the start of a rise to 666 in the following week. A big move started at 543.22.
Price treated the old weekly low as a level. The lows of 24 June, 25 June, 30 June and 1 July were 546.32, 540.50, 543.93 and 537.31: all within 6 dollars of 543.22, on a daily ATR of about 17. Twice price went below and closed back above. Not one daily close was below the level; the lowest close was 546.84. On 5 July price was at 593.83, 50 dollars higher.
When a daily level and a weekly level are both near price, the higher timeframe wins. A weekly level is seen by more players, so it carries more weight. This is true for every kind of level.
What are the levels at a new high or low?
Sometimes there is no history at all: price is at an all-time high, or at its lowest price in years. There is nothing to the left to draw from.
In that case the high and the low of the previous day are levels. Each new day either goes beyond yesterday’s extreme or fails to. When a day goes above yesterday’s high and cannot close above it, that high is the level the false breakout happened at (false-breakout levels).
What most traders miss. Drawing levels on the 5-minute chart feels more precise. It is the opposite. The precision of a level comes from the event behind it, not from the size of the candles. A daily level is still an exact price, to the cent, and you get to that cent by zooming in on the entry chart. You do not get a level by drawing it there.
Common mistakes
- Drawing levels on the chart you trade. A 5-minute “level” is one of 9,637 turns. Fix: draw on the daily chart, then go down a timeframe to watch the approach.
- Looking back two weeks. Fix: six months on the daily chart; the weekly or monthly chart when there is no history at the price.
- Letting the small chart overrule the big one. Fix: if the 5-minute chart contradicts the daily chart, there is no trade. The higher timeframe wins.
- Inventing levels at a new high. Fix: with no history to the left, use the previous day’s high and low.
Key takeaways
- Support and resistance levels are always taken from the daily chart; the weekly and monthly charts add older ones.
- Six months of daily candles fit on one screen; the same six months is 4,392 hourly candles.
- NVIDIA made 25 daily turns in six months against 704 hourly ones. Few daily turns, few real levels.
- The 4-hour chart is a cross-check, the 1-hour chart shows the approach, the 5 to 30-minute chart shows the entry. None of them draws a level.
- When levels from two timeframes are near price, the higher timeframe wins.
- At a new extreme, the previous day’s high and low are the levels.
Lesson test · 8 questions
Check yourself
Can you pass on the first try?
Passing the test completes this lesson. Tests in a module open in order, each after the one before it. A first-try pass scores 100%. Each wrong answer costs 10 points, and every 10 wrong answers lock the test for 30 minutes. Once you pass, your score is final, except that a score of 50 or less can be retaken once.
-
Which chart are support and resistance levels taken from?
-
In the same six months NVIDIA made 25 local highs and lows on the daily chart. About how many did it make on the 1-hour chart?
-
Why does a daily high work better as a level than a 5-minute high?
-
What is the 4-hour chart for in this method?
-
The daily chart shows the prerequisites for a breakout, but the 1-hour chart shows price being pushed away from the level. What do you do?
-
Price is at a price it has not traded at for two years. What do you do?
-
A daily level and a weekly level are both near price. Which carries more weight?
-
Price is at an all-time high, with no history to the left. Which prices are levels?
Free account
Take the test and keep your score
- Your answers are checked and every lesson you pass is marked complete.
- Your scores build into your course score, on any device.
- You come straight back to this question after signing up.
Next: the candle that forms a level. ChartThread’s levels page shows the same daily levels on every timeframe, so when you switch to the hourly or 5-minute chart you watch the approach to the right prices.
Terms in this lesson
Related lessons
Educational content, not financial advice. Trading carries a risk of loss.