Touches to the cent: why precision matters
A level is a number, not a zone. The strongest sign that your number is right is price coming back and stopping on it, to the cent.
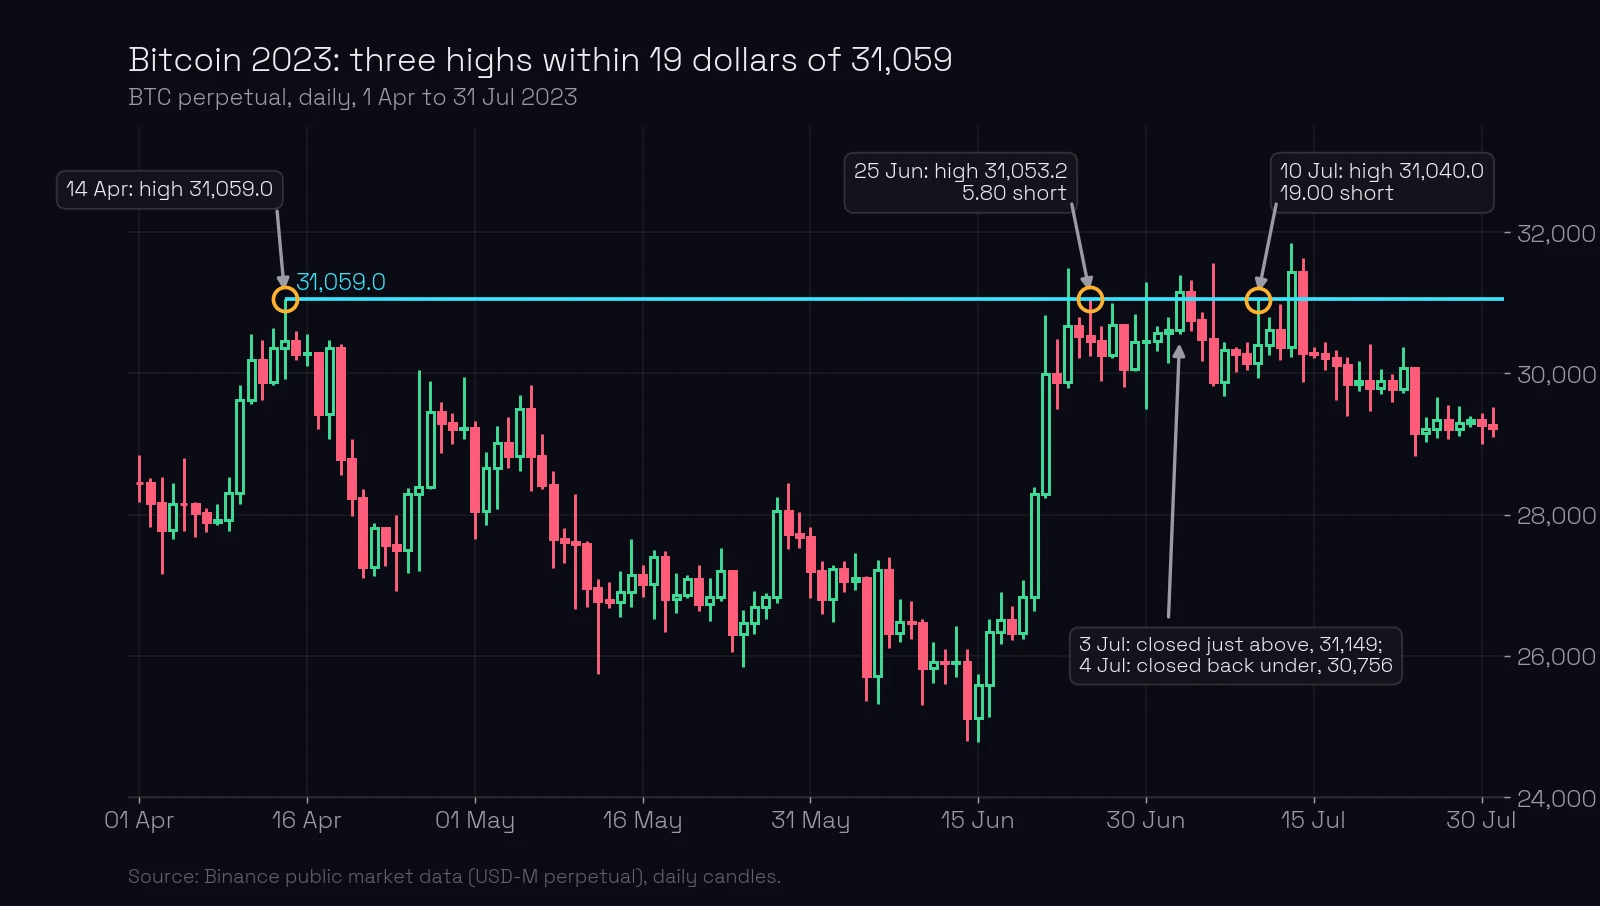
Bitcoin’s perpetual contract made a high of 31,059.0 on 14 April 2023. On 25 June the high was 31,053.2, 5.80 short. On 10 July it was 31,040.0, 19 short. Three highs within 19 dollars on a price of 31,000: six hundredths of a percent.
What you’ll learn
- Why a precise touch says more than a bounce “around” a level.
- How to measure precision in daily ATR, so it means the same on bitcoin and on XRP.
- What repeated exact touches tell you about the player at the price.
- What a near miss is, and why it confirms a level without touching it.
- How ChartThread counts touches and near misses.
Why precision matters
Price does not stop at an exact number by chance. A limit order is placed at one price, and when a player is big enough, its order is what stops the market. Every time price comes back and stops on that number, the same order, or the same player, is still there.
That is why this course treats a level as an exact number (how to draw a level) and takes it from the exact high or low of one candle (the candle that forms a level). A zone can be explained by anything. A touch to the cent can only be explained by someone standing at that cent.
How close is “to the cent”
Measure the miss in the daily ATR, the instrument’s normal daily travel, so the same rule works at 31,000 and at 0.55.
On the bitcoin chart the daily ATR on 25 June 2023 was about 1,220, so the 5.80 miss is 0.005 ATR. On 10 July the ATR was about 830 and the 19.00 miss is 0.023 ATR. Both are touches: the market reached the number and stopped on it.
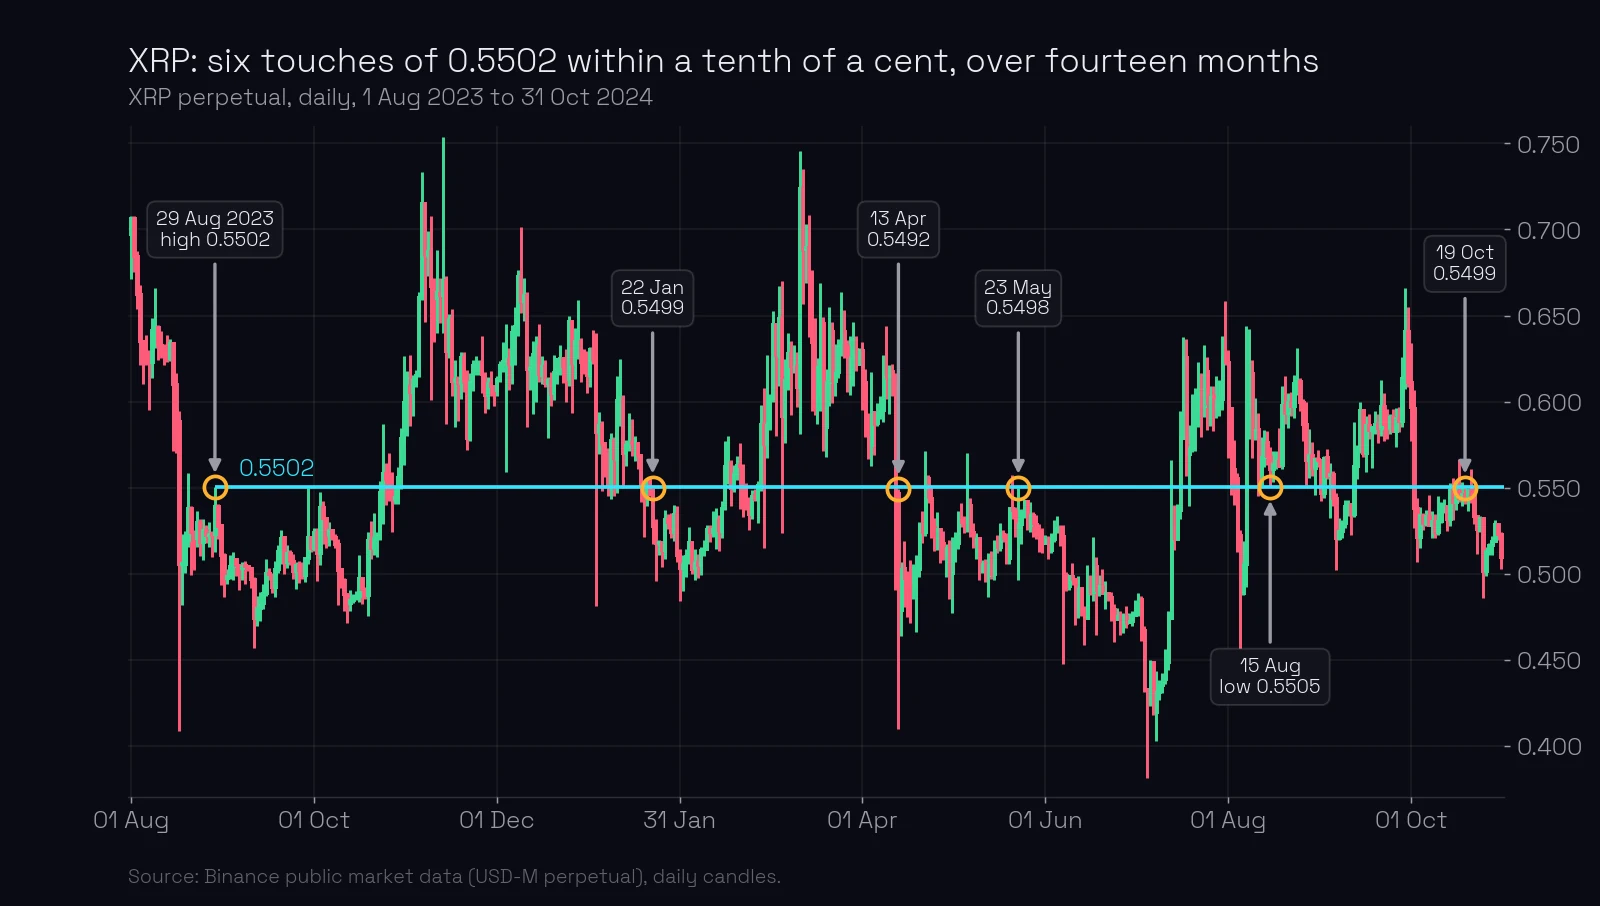
XRP’s contract shows the same thing at a different scale. Its high of 29 August 2023 was 0.5502. Over the next fourteen months price came back five times and stopped within a tenth of a cent: 0.5499 on 22 January 2024, 0.5492 on 13 April, 0.5498 on 23 May, 0.5499 on 19 October, and once from above, a low of 0.5505 on 15 August. The widest miss is 0.0010 on a daily ATR of about 0.06 that day, under 0.02 ATR. After the April touch price fell to 0.4099 the same day; after the May touch, to 0.4475 within two weeks; after the October touch, to 0.4858.
Repeated touches and the big limit player
One precise touch is a sign. Several are a pattern. In this course, four to five touches of the same price show that there is a big limit player in the market: someone with enough size to meet the market at one number again and again (limit-player levels coming soon). XRP’s 0.5502 had five returns within a tenth of a cent. Whoever sold there in August 2023 was still selling there in October 2024.
The touches do not have to come from the same side. XRP’s low of 0.5505 on 15 August 2024 came from above: the number that had been resistance was, for a day, support, a mirrored level. The player at the price does not care which way the market arrives.
Honesty about the bitcoin chart: between the second and third touch, on 3 July, price closed just above 31,059, at 31,149, and on 4 July it closed back under, at 30,756. A level that is closed through is sawed and needs reconfirming (how a broken level gets reconfirmed coming soon). The 10 July touch, 19 short, was exactly that reconfirmation. Three days later the level broke for good and price ran to 31,850.
Near misses
A candle that comes close to the level and turns before reaching it is a near miss. It is not a touch, and it confirms the level all the same: the market turned because the level was there, and the player at the price did not even have to be hit.
Solana’s low of 12 April 2026, 81.23, is the example from the candle that forms a level. On 29 April price stopped at 81.31, 8 cents short on a daily ATR of 2.90: a touch, 0.03 ATR. On 23 May it stopped at 81.36, 13 cents short on an ATR of 3.68: 0.035 ATR, a near miss. Both days the market turned up from the line without printing it. On BNB, after the low of 573.16 on 18 June 2026, the low of 11 July was 573.38, 22 cents short, 0.017 ATR.
Near misses have their own lesson (candles that almost touch the level coming soon). The point here is the scale: a miss of a few hundredths of an ATR is the level working.
How ChartThread counts it
ChartThread reads every candle after a level formed and classifies what it did at the line. An extreme within 0.03 of that day’s daily ATR of the exact price is a touch; within 0.15 ATR, a near miss. Each level on the levels page carries its touch count, the distance of its closest touch, a flag for a touch to the exact tick, and its near misses, so you can see at a glance whether a line has been respected to the cent or only approximately.
What most traders miss. The exact number is the evidence. “It bounced around 31,000” could be ten different lines. “It stopped at 31,053.2, 5.80 under the April high” is one line, one player, and a stop you can place.
Common mistakes
- Drawing the level through the middle of the touches. Fix: the level is the exact high or low of the forming candle; the touches are measured against it, not averaged into it.
- Calling a 1 ATR miss a touch. Fix: measure in daily ATR; a touch is a few hundredths.
- Ignoring a touch from the other side. Fix: the price is what matters; a level touched from both sides is a mirrored level and stronger for it.
- Treating a sawed level as untouched. Fix: a close through the line needs reconfirmation before the next touch counts.
Key takeaways
- A level is an exact number; a touch to the cent is the strongest sign the number is right.
- Measure a miss in daily ATR: a few hundredths is a touch.
- Repeated exact touches show one player at one price; four or five show a big limit player.
- A near miss confirms the level without touching it.
- The exact number gives you a stop you can place; a zone does not.
Lesson test · 7 questions
Check yourself
Can you pass on the first try?
Passing the test completes this lesson. Tests in a module open in order, each after the one before it. A first-try pass scores 100%. Each wrong answer costs 10 points, and every 10 wrong answers lock the test for 30 minutes. Once you pass, your score is final, except that a score of 50 or less can be retaken once.
-
Why is a touch to the cent a stronger sign than a bounce ‘around’ a level?
-
A level is at 200.00, the daily ATR is 5.00 and today’s low is 200.12. What is it?
-
The same level at 200.00 and a later low at 200.60 on an ATR of 5.00. What is it?
-
Bitcoin made a high of 31,059.0, then 31,053.2, then 31,040.0. Why measure the misses in daily ATR rather than in dollars?
-
Price stops at the same number five times over a year. What does the course say about the player at that price?
-
A level that was resistance is touched from above, to the cent, and price turns up. What is that?
-
Between two precise touches, price closed just above the level for two days and came back under. How does that change the next touch?
Free account
Take the test and keep your score
- Your answers are checked and every lesson you pass is marked complete.
- Your scores build into your course score, on any device.
- You come straight back to this question after signing up.
Next: where a big move stopped: the level behind it coming soon. On ChartThread’s levels page every level shows its touches and its closest miss, in ATR, so you can see which lines are respected to the cent.
Terms in this lesson
Related lessons
- Level type 4: limit-player levels coming soon
- Long tails: why the longest wick makes the strongest level coming soon
- Shallow false breakouts make a level stronger coming soon
- Additional touches: when repeats confirm a level coming soon
- Near misses: candles that almost touch the level coming soon
- What makes a level strong? The full checklist coming soon
Educational content, not financial advice. Trading carries a risk of loss.