Strongest support and resistance: the situation decides
Traders love to rank levels: “strong support”, “weak resistance”, “major level”. This course never does. A level has no power of its own. The situation around it decides.
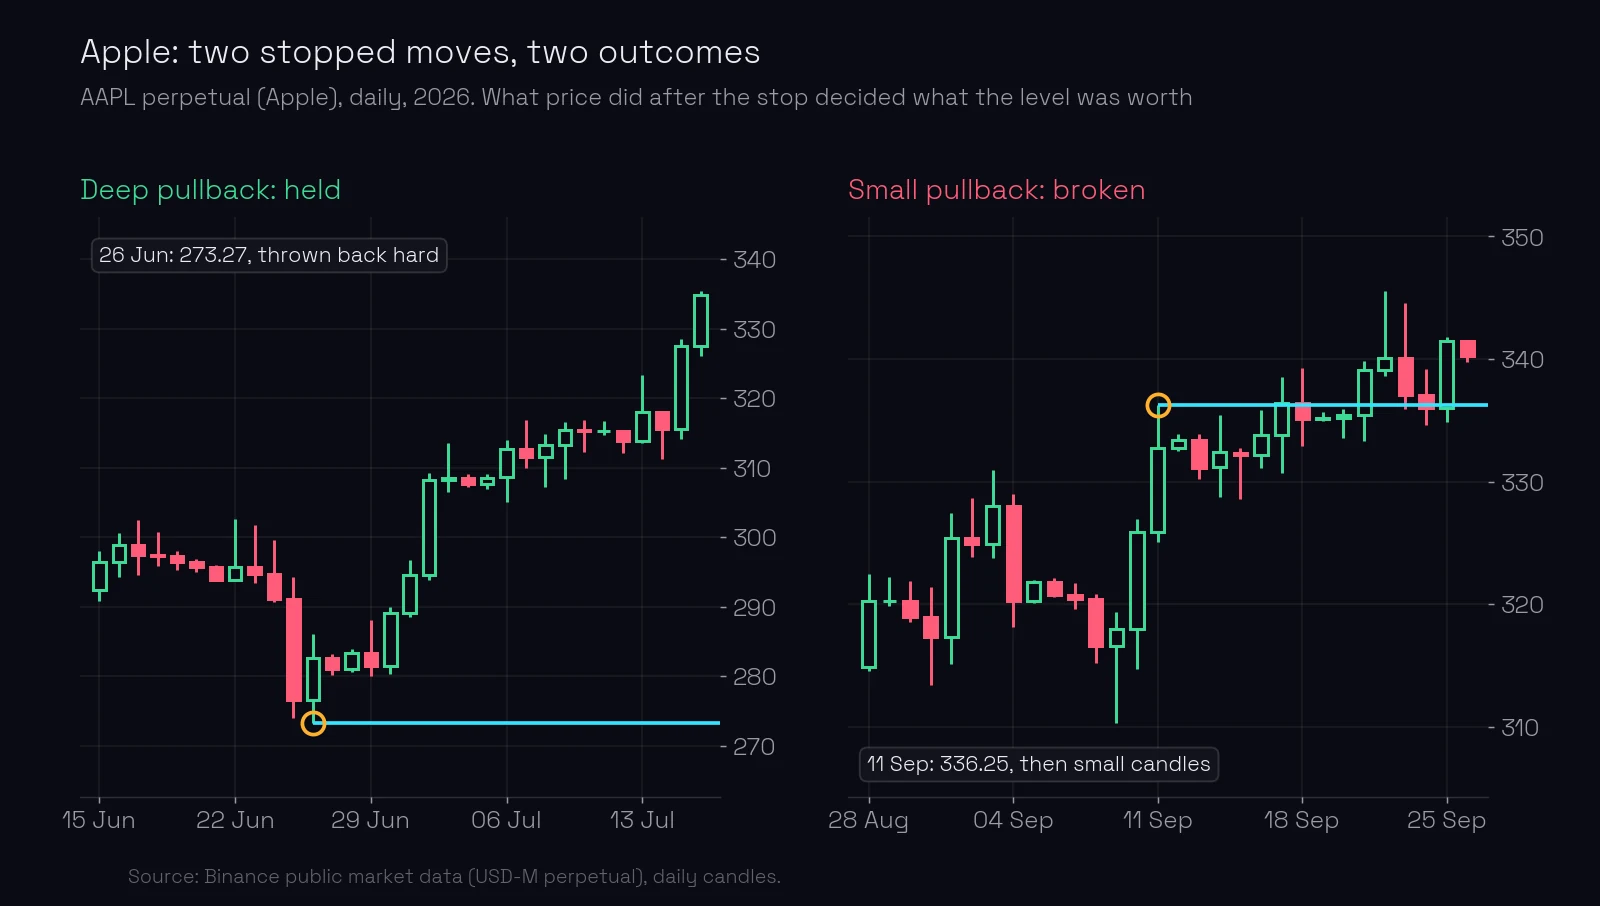
Both charts are Apple, both in 2026, both a big move that stopped at one price: the same kind of level. One held. The other broke within a week.
What you’ll learn
- Why levels are never ranked by power.
- What “the situation” around a level means, in four questions.
- What happens after a big move that stops with only a small pullback, measured on 306 cases.
- When a level can be re-adapted, and by how much.
- Why many correct levels are not usable.
Are some support and resistance levels stronger than others?
Not by themselves. Levels are never classified by power. Everything depends on the current market situation. A level formed by a huge candle can be sawed through in a week, and a quiet repeated low can hold for months.
This matters because a label like “strong support” makes you stop looking. You buy the “strong” level without checking what price is doing around it today. A level tells you where something may happen. Whether it happens depends on what is going on around that price right now.
Two stopped moves on Apple
26 June 2026, the low 273.27. Apple’s contract fell from 302.55 to 273.27 in four days, almost 10%. At 273.27 the fall stopped and price was thrown back. Within five days it was at 296.71, 3.6 daily ATR away from the low (the ATR was 6.53). By 2 July it reached 309.16. The level held: someone bought the fall at 273.27 and kept buying.
11 September 2026, the high 336.25. Apple rose from 310.31 to 336.25 in three days. At 336.25 the rise stopped. But price did not fall back. For five days it rested just under the level in small candles; the deepest pullback was to 328.60, only 1.2 ATR away. On 17 September price closed above 336.25, and by 22 September it was at 345.53.
The level was the same kind of level. What price did after the stop was different, and that told the story.
A small pullback after a big move: the move often continues
When an instrument makes a big move, stops, and pulls back only a little, the move is likely to continue and break the level. The reason: the small players on the losing side close their losing positions, and a big player stops the move with limit orders for a while. Once that player is filled, nothing stands in the way, and the move goes on.
We checked this on real data.
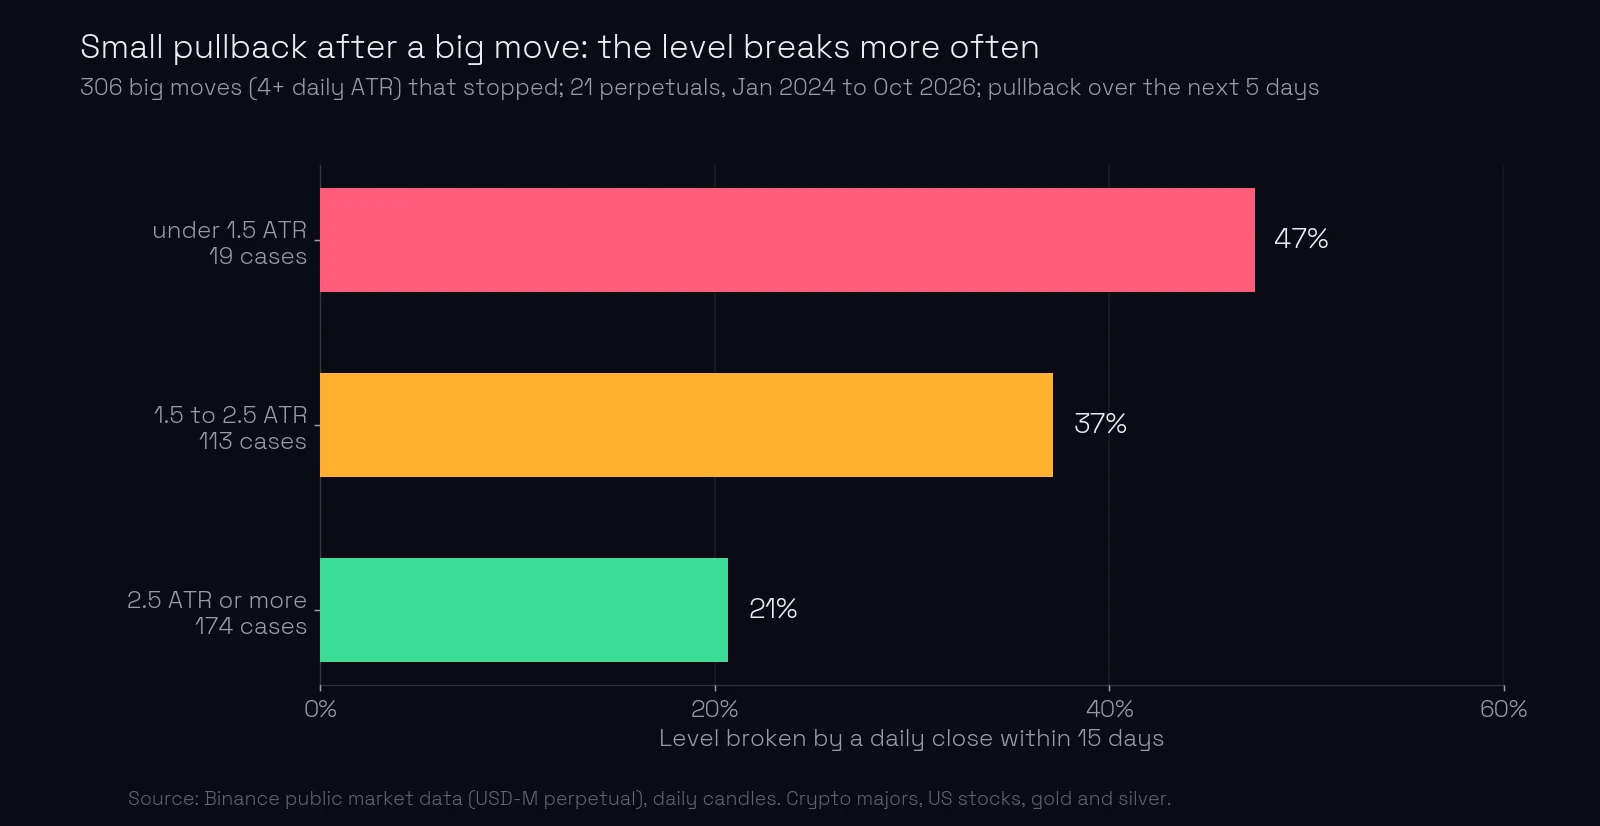
We took every big move of at least 4 daily ATR over 10 days that stopped at a clear high or low, on 21 contracts (Bitcoin, Ethereum, BNB, Solana and XRP; US stocks such as Apple, NVIDIA and Tesla; gold and silver), from January 2024 to October 2026. Then we measured how far price pulled back over the next five days, and whether a daily close went beyond the level within 15 days.
- Pullback under 1.5 ATR: the level broke in 47% of cases (19 cases).
- Pullback of 1.5 to 2.5 ATR: 37% (113 cases).
- Pullback of 2.5 ATR or more: 21% (174 cases).
The smaller the pullback, the more often the level broke. A deep throwback, as on Apple in June, shows a buyer who does not just stop the move but reverses it. A shallow pause, as in September, often shows a move that is only catching its breath.
The first group is small, 19 cases, because a big stop with almost no pullback is rare. Read the numbers as a direction, not a precise probability.
Four questions about the situation
Before you trust a level, ask:
- What did price do after the level formed? A deep throwback, or a shallow pause next to it? See above.
- How fast is price coming back, and how does it behave at the level? Note the speed of the approach and the candles around the level: does price slow down and stall, or run into the level on big candles? The 1-hour chart shows this (which timeframe), and pillar two, energy explains what the approach tells you.
- How much accumulation is there? The longer price was squeezed into a range before reaching the level, the more power it has to go further. A long accumulation under a level is fuel for a breakout (pillar three, direction).
- Was the level sawed through? If price crossed it again and again, with closes on both sides, nobody defends it today. If it was drawn correctly, there is nothing wrong with the level; you just cannot use it until it is confirmed again (sawed-through levels).
When can a level be re-adapted?
Only when there is empty space ahead: a bigger range in front of the level, or no resistance at all for a long way, a vacuum. Then the level can be used for a trade through it, in the direction of the vacuum, because price has room to run.
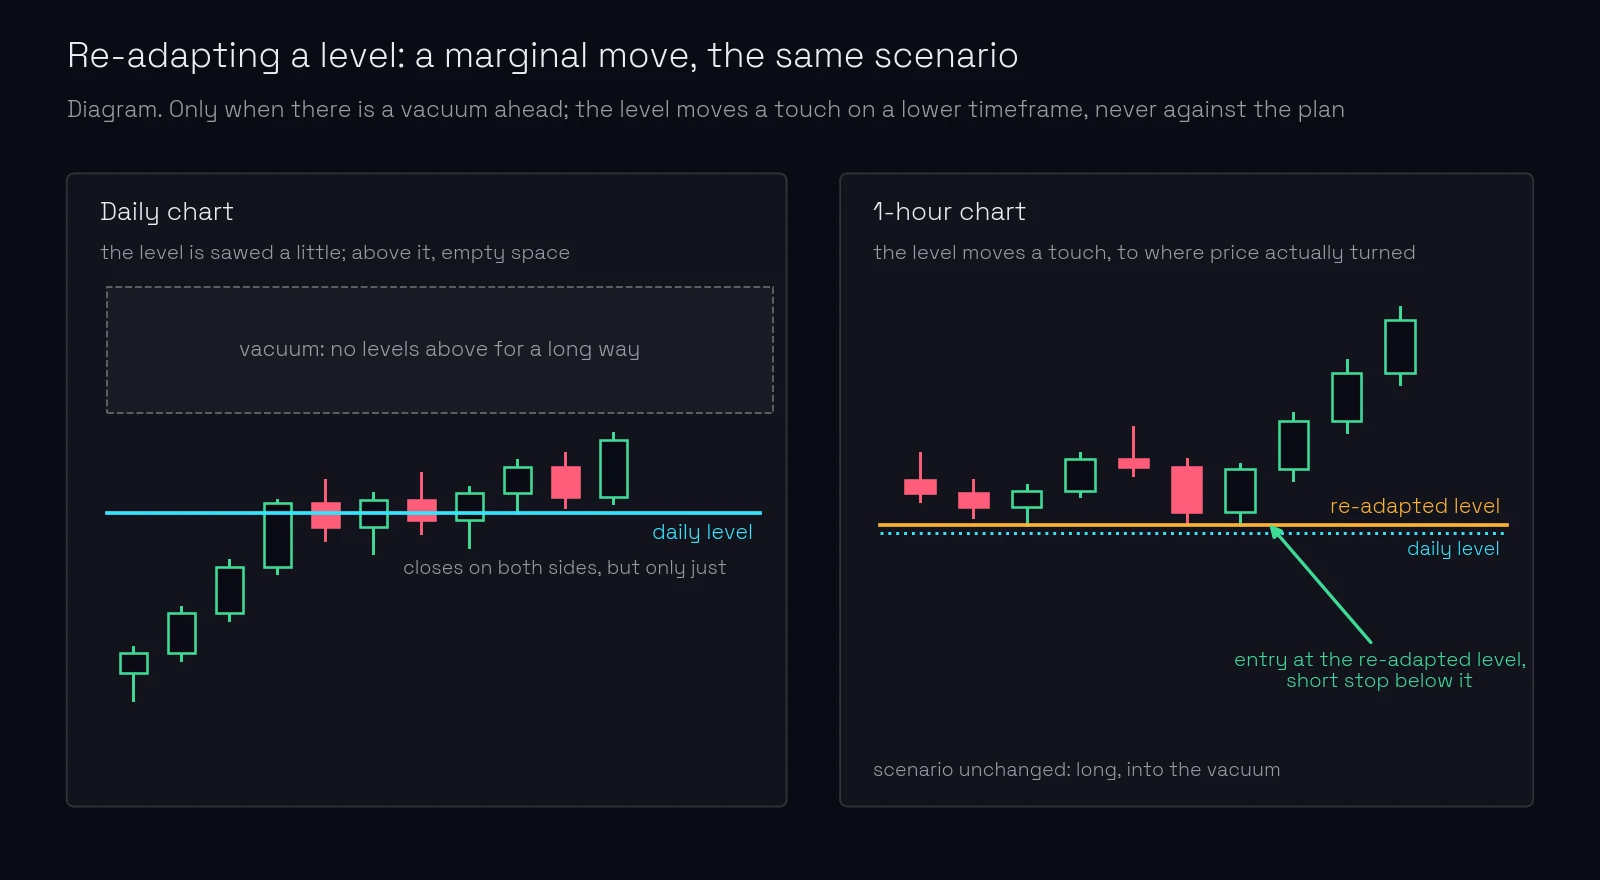
The diagram shows the one case where a level may be moved. On the daily chart the level has been sawed a little on the way up, with closes just on both sides of it, but above it there is a vacuum. On the 1-hour chart you can re-adapt the level: move it a touch, to the price where the hourly candles actually turned, and enter there with a short stop. Two rules keep this honest. The adaptation is marginal, a few ticks, not a new level. And it never contradicts the original scenario: the plan was long into the vacuum, and it stays long into the vacuum.
Example: reading Apple’s September level
Put the four questions to Apple on 16 September, the day before the break.
- After the level formed: five days of small candles, the deepest pullback 1.2 ATR. Shallow: the move may continue.
- The approach and the behaviour: price sat right under 336.25 for days instead of leaving it. Nobody was pushing it away.
- Accumulation: five days squeezed between 328.60 and 336.25, under the level.
- Sawed through? Not yet: no close above the level until 17 September.
Three of the four answers pointed the same way: a shallow pause, nobody pushing price away, a squeeze under the level. On 17 September price closed above.
What most traders miss. There are many theoretically correct levels, but not every level can be used. A level drawn by the book is only a candidate. The situation around it turns it into a trade or into a level you just watch. And when a correct level fails, it is not your drawing that was wrong: the situation changed.
Common mistakes
- Ranking levels as “strong” and “weak”. Fix: describe the situation instead: what price did after the level formed, how it approaches now.
- Buying a level because it held last time. Fix: check what happened since; a small pullback after a big move is a warning, not a gift.
- Ignoring a squeeze under the level. Fix: long accumulation under a level is fuel for a breakout.
- Moving a level to fit the last candle. Fix: a level is re-adapted only with a vacuum ahead, by a margin, on a lower timeframe, and never against the original plan.
- Blaming the drawing when a correct level breaks. Fix: if it was drawn correctly, leave it; the situation decided.
Key takeaways
- Levels are never classified by power; the market situation decides.
- The same kind of level held on Apple in June and broke in September.
- After a big move that stops with a small pullback, the move often continues: on 306 cases the level broke in 47% of cases after a pullback under 1.5 ATR, against 21% after 2.5 ATR or more.
- Ask four questions: what happened after the level formed, how price approaches, how much accumulation, was it sawed through.
- A level can be re-adapted only when there is a vacuum ahead, marginally, and never against the original scenario.
- Many levels are correct; few are usable.
Lesson test · 7 questions
Check yourself
Can you pass on the first try?
Passing the test completes this lesson. Tests in a module open in order, each after the one before it. A first-try pass scores 100%. Each wrong answer costs 10 points, and every 10 wrong answers lock the test for 30 minutes. Once you pass, your score is final, except that a score of 50 or less can be retaken once.
-
How does this course rank levels by power?
-
Apple stopped at 273.27 and was thrown back 3.6 ATR in five days. Apple later stopped at 336.25 and pulled back only 1.2 ATR. Which level was more likely to break?
-
In the test on 306 big moves, how often did the level break within 15 days after a pullback of 2.5 ATR or more?
-
Why does a small pullback after a big move often lead to a breakout?
-
Price spent a week squeezed in a narrow range just under a level. What does that add to the picture?
-
When may a level be re-adapted?
-
A level you drew correctly was sawed through. What do you do?
Free account
Take the test and keep your score
- Your answers are checked and every lesson you pass is marked complete.
- Your scores build into your course score, on any device.
- You come straight back to this question after signing up.
Next: level type 1, trend-change levels. On ChartThread’s levels page you see every level with the candles around it, so you can read the situation, not just the line.
Terms in this lesson
Related lessons
Educational content, not financial advice. Trading carries a risk of loss.