How to find key levels: the candle that forms a level
Every level has a birthday: one candle on the chart where it was formed. Find that candle, take its exact high or low, and you have the level.
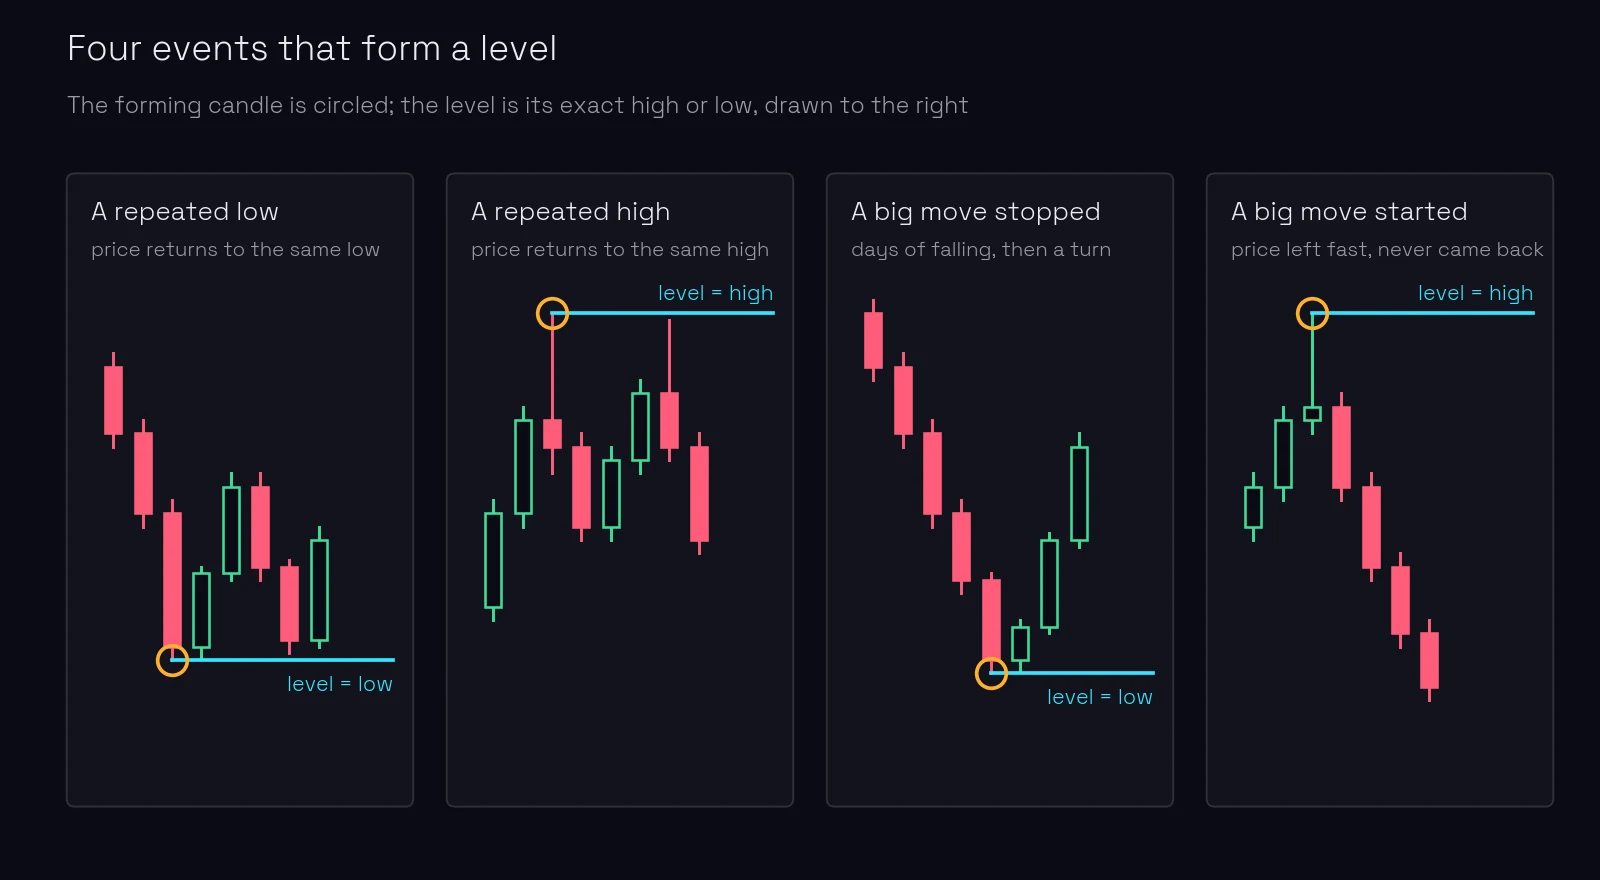
Traders call it the level-forming candle, the bar that formed the level. This lesson is about finding it.
What you’ll learn
- What the level-forming candle is, and why every level needs one.
- The four events that make good levels, on four real charts.
- Why the first stop of a big move is a level.
- Why any price that stopped a move points to a big player.
- Why the tail of a false breakout at an extreme is not a new level.
What is the level-forming candle?
A level is drawn from left to right, starting at the candle where the important event happened (how to draw a level). That candle is the level-forming candle, and the level is its high or its low:
- If the event stopped a fall, the level is the candle’s low.
- If the event stopped a rise, the level is the candle’s high.
- Never the open, the close or the body (zones vs levels).
If several candles share almost the same low, the forming candle is the first of them, on the left. The later ones are tests of the level. They confirm it, but they did not form it.
Being able to point at the candle keeps you honest. “There is support around here” cannot be checked. “The low of 12 April, 81.23” can.
Which events form good levels?
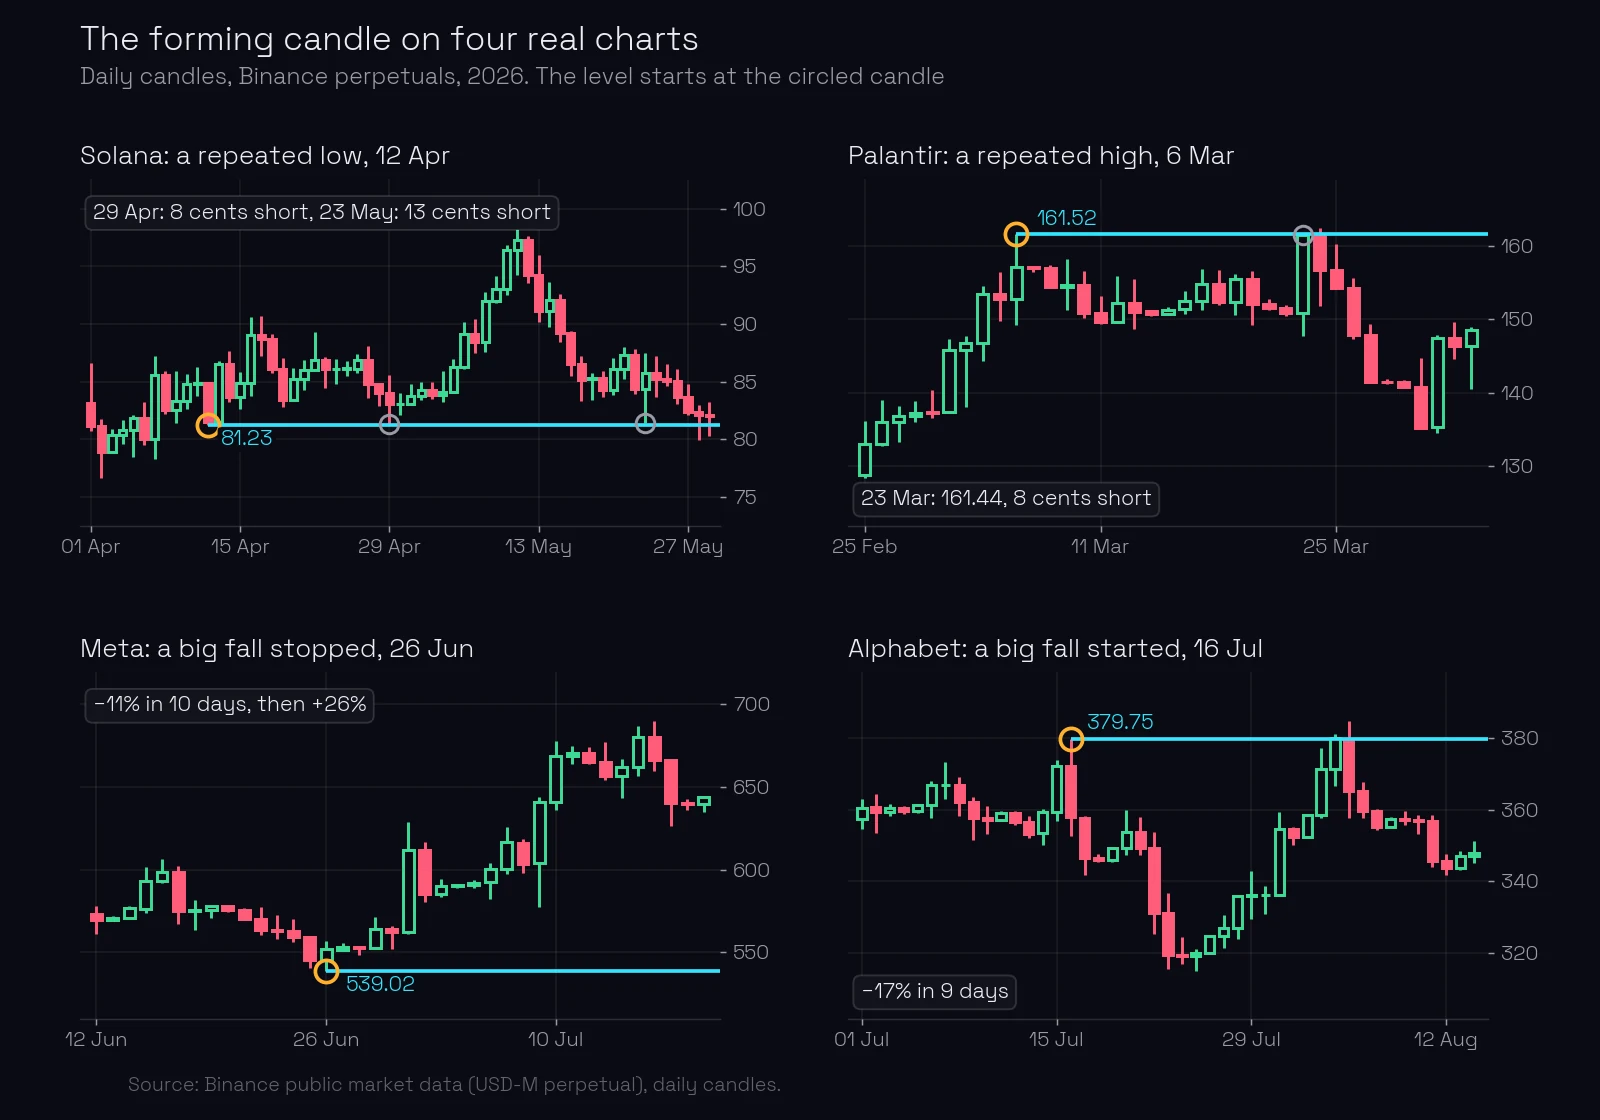
1. A repeated low
Price makes a low, leaves, and later comes back to the same price and turns again. On Solana’s contract price fell to 81.23 on 12 April and turned. On 29 April it came back and stopped at 81.31, 8 cents short, and from there rose 21% to 98.36 by 11 May. On 23 May it came back once more and stopped at 81.36, 13 cents short, on a daily ATR of 3.66. The forming candle is 12 April, the first of the three. 29 April and 23 May are tests.
2. A repeated high
The same thing upside down. Palantir’s high of 6 March, 161.52, was met again on 23 March at 161.44, 8 cents short, and over the next eight days price fell 17%. You saw this chart in zones vs levels.
3. A big move stopped
A move of several days ends at one price, and price turns. Meta’s contract fell from 606.24 on 16 June to 539.02 on 26 June, 11% in ten days. The fall stopped at 539.02: the candle of 26 June went only 1.65 below the previous day’s low and closed at 551.77, and for the next four days price held within 13 dollars above the level, under one daily ATR, without going under it. On 1 July it ran from 561.20 to 628.40 in one day, and by 10 July it was at 677.84, 26% above the level. The candle of 26 June formed the level, and its low is the level.
A fall that ends on a spike is different. When the last candle stabs far below the previous lows and price closes back above them, the spike is the tail of a false breakout, and a tail is not a level. More on that below.
4. A big move started
Price leaves one price fast and does not come back. On 16 July Alphabet’s contract rose to 379.75 and closed at 357.83, 22 dollars below its high. Over the next nine days price fell 17%, to 315.00. The level is the high of 16 July: the price where sellers took over.
Lessons later in this module look at each of these in detail: trend-change levels and where a big move stopped among them.
The first stop of a big move is a level
A big move rarely runs in one piece. It runs, stops for a day or two, consolidates or makes a small correction, and then runs on. The price where it first stopped is a level, even though the move went past it. Its forming candle is the candle of the pause.
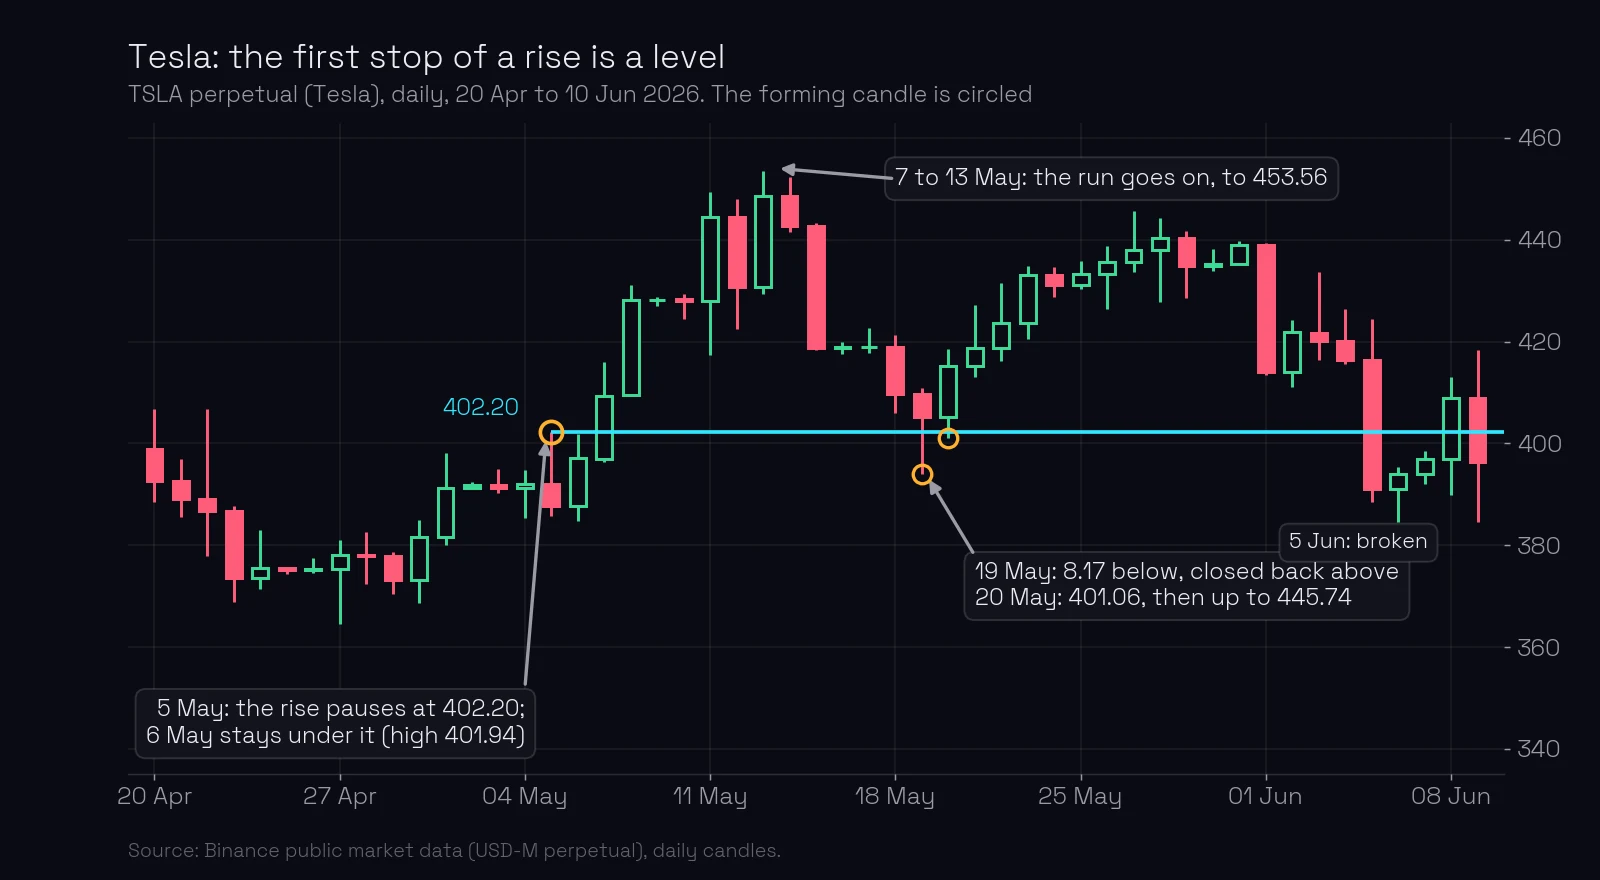
Tesla in May 2026 shows it. The rise from 368.76 on 30 April paused at 402.20 on 5 May: a candle with a long upper tail that closed at 387.67, almost 15 dollars below its high. On 6 May price stayed under the level; the high was 401.94, 26 cents short. Then the run went on: 416.07 on 7 May, 431.20 on 8 May, 453.56 on 13 May, 51 dollars above the pause.
Two weeks later price came back to the first stop. On 19 May it went 8.17 below 402.20 and closed back above it, at 405.12: a false breakout. On 20 May it stopped at 401.06 and turned; by 27 May price was at 445.74. The level formed by a one-day pause held the return, with a daily ATR of about 16. It broke on 5 June, when price closed at 391.00, and that is normal: a level is right until the situation changes (no level is strong on its own).
Why any stop is a footprint
Any price that stops a rise or a fall tells you there is a powerful limit player in the market. Price does not stop by itself. When it falls for days and then stops at one price, someone bought everything that was sold there, with limit orders waiting at that price.
That is why the forming candle matters: it is the moment that player showed up. Its high or low is the price where the orders were.
A false breakout’s tail is not a new level
At an extreme, price often pokes past the level and closes back. The tail of that candle is not a new level.
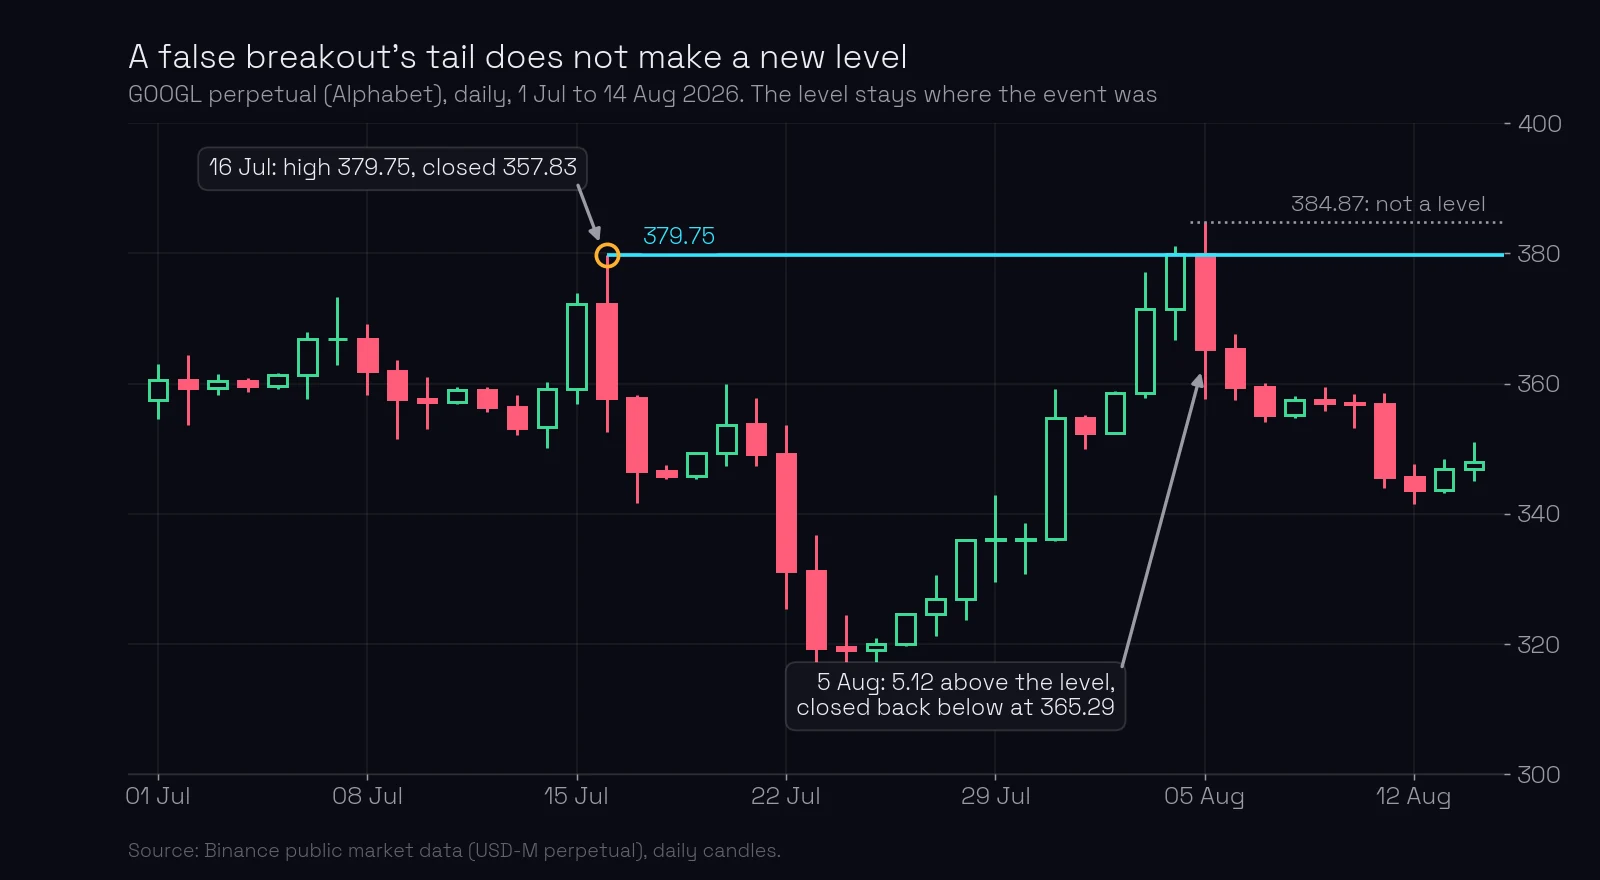
On 5 August Alphabet came back to 379.75, went 5.12 above it to 384.87, and closed back below at 365.29. That was a false breakout: buyers pushed through, could not hold, and price fell back under the level.
The new high, 384.87, is not a level. Nothing happened there except that the push ran out. The event was the failure to hold above 379.75, so the level stays at 379.75. A false breakout does not move the level. It makes it stronger (false-breakout levels).
Example: finding the forming candle on Meta
Walk through the Meta chart of June as you would on your own screen.
- Name the event. A fall from 606.24 to 539.02 in ten days, 11%, and then a turn.
- Find the candle. The lowest low of the fall is on 26 June: high 557.09, low 539.02, close 551.77.
- Check it is not a spike. The previous day’s low was 540.67, so the candle went only 1.65 further. Nothing to close back above: this is a stop, not a false breakout.
- Take the right price. The event stopped a fall, so the level is the low: 539.02. Not the close, 551.77.
- Draw it to the right. The line starts on 26 June and runs into the future.
- Check it later. Price held just above the level for four days, then rose to 677.84 by 10 July. On 29 July it came back, went 19.59 below and closed back above at 542.90; on 31 July it stopped at 541.47 and rose to 598.25 within three days.
What most traders miss. The extreme of a move is not always its forming candle. When price stabs past an old high or low and closes back, the new extreme is the end of a failed push, not a new event. Beginners move their level to every new tail, and after a few false breakouts the level has drifted to a price where nothing ever happened.
Common mistakes
- No candle behind the line. Fix: for every level, name the date of its forming candle.
- Taking the close of the forming candle. Fix: the low if it stopped a fall, the high if it stopped a rise.
- Picking the latest touch as the forming candle. Fix: the first candle with that extreme formed the level; later ones test it.
- Ignoring the pause in the middle of a run. Fix: the first stop of a big move is a level; mark its high or low.
- Moving the level to a false breakout’s tail. Fix: the level stays at the price the breakout failed at.
Key takeaways
- Every level has one forming candle; the level is its exact high or low.
- Good levels: a repeated low, a repeated high, a big move that stopped, a big move that started.
- The first stop of a big move is a level too: Tesla’s one-day pause at 402.20 held the return two weeks later.
- Any price that stopped a rise or a fall shows a powerful limit player.
- The tail of a false breakout at an extreme is not a level; the level stays where the event was.
Lesson test · 7 questions
Check yourself
Can you pass on the first try?
Passing the test completes this lesson. Tests in a module open in order, each after the one before it. A first-try pass scores 100%. Each wrong answer costs 10 points, and every 10 wrong answers lock the test for 30 minutes. Once you pass, your score is final, except that a score of 50 or less can be retaken once.
-
What is the level-forming candle?
-
A fall of ten days ends on a candle with high 557.09, low 539.02 and close 551.77. Where is the level?
-
Which of these is NOT one of the four events that make good levels?
-
Three candles have lows of 81.23 (12 April), 81.31 (29 April) and 81.36 (23 May). Which formed the level?
-
Tesla rose to 402.20, paused for one day under it, then ran on to 453.56. What is 402.20?
-
Price fell for days and stopped at one price. What does that tell you?
-
A level is at 379.75. Price goes to 384.87 and closes back at 365.29. Where is the level now?
Free account
Take the test and keep your score
- Your answers are checked and every lesson you pass is marked complete.
- Your scores build into your course score, on any device.
- You come straight back to this question after signing up.
Next: no level is strong on its own. On ChartThread’s levels page every level line starts at its forming candle, so you can see the event behind each one.
Terms in this lesson
Related lessons
Educational content, not financial advice. Trading carries a risk of loss.