Level type 2: false-breakout levels
Price goes beyond yesterday’s low. The bears cheer. Then the candle closes back above it.
That low is now a level, and the candle that failed to break it is the proof. This is the second level type in the course: the false-breakout level.
What you’ll learn
- What a false breakout is: beyond the price, but not confirmed.
- Which price becomes the level and which candle is the evidence.
- Why a false breakout can only happen towards a level, and what “visible” means.
- Why the tail of the failed candle is not a new level.
- What a false breakout does to a level: it strengthens it.
What is a false-breakout level?
A false breakout means the instrument was unable to update the price above a certain high or below a certain low. Update means confirm, and confirm means close. A candle that trades below yesterday’s low but closes back above it did not update the low. It tried and failed.
When that happens, the previous day’s high or low becomes a level: the price towards which the false breakout happened. The candle that failed is not the level. It is the evidence that someone defended the price.
This type is an after-the-fact event. You cannot draw it while the candle is still open, because the only thing that decides it is the close. A trend-change level is visible while the move stops; a false-breakout level exists only once the failed candle has closed.
The candle that failed, step by step
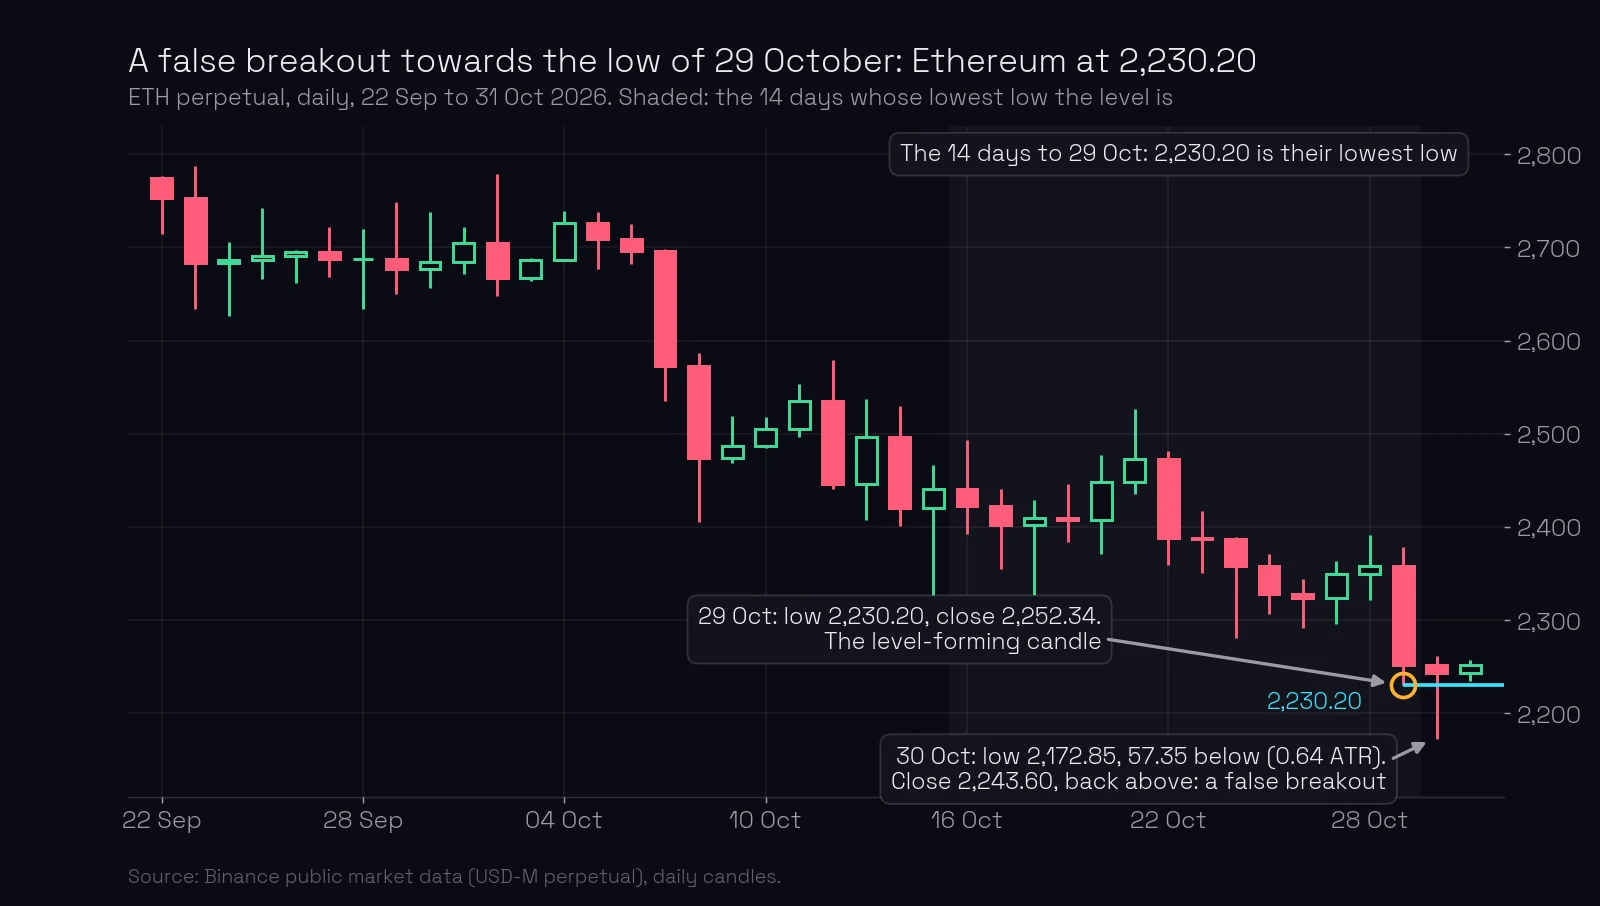
Ethereum’s perpetual contract fell through October. On 29 October it made a low of 2,230.20 and closed at 2,252.34. On 30 October it traded down to 2,172.85, 57.35 below that low, and closed at 2,243.60, back above it.
- The breach. 30 October went 57.35 below the low of 29 October. The daily ATR was 89, so the wick reached 0.64 ATR below the level.
- The close. 2,243.60, above 2,230.20. The low was not confirmed.
- The level. 2,230.20, the low of 29 October. The level-forming candle is 29 October, not 30 October.
- The evidence. The 30 October candle: a long lower wick, a rejection of everything below the level.
- The next day. 31 October made a low of 2,234.58, 4.38 above the level, and closed at 2,251.57. The level held again, this time without being breached.
Read the chart from left to right: the level starts on 29 October and runs to the right. The failed candle sits one day after it.
A false breakout can only happen towards a level
A false breakout is not any wick. It is a failure to confirm a price that mattered. The price it happened towards has to be a visible border on the chart: the lowest low or the highest high of the recent days, a fresh swing extreme, a rejected big candle. A poke below yesterday’s candle in the middle of a trading range is noise. Draw a level from every one of those and the chart becomes a sawed zone with a line through the middle.
On ChartThread the engine measures “visible” as this: the violated low must be the lowest low of the trailing 14 days on its side, and a violated high must be the highest high of those 14 days. The 29 October low on Ethereum was exactly that: no lower low in the 14 days before it (the shaded area on the chart). The number 14 was my call when the rule was built, because a false breakout in the middle of a channel looked too sawed to be a level.
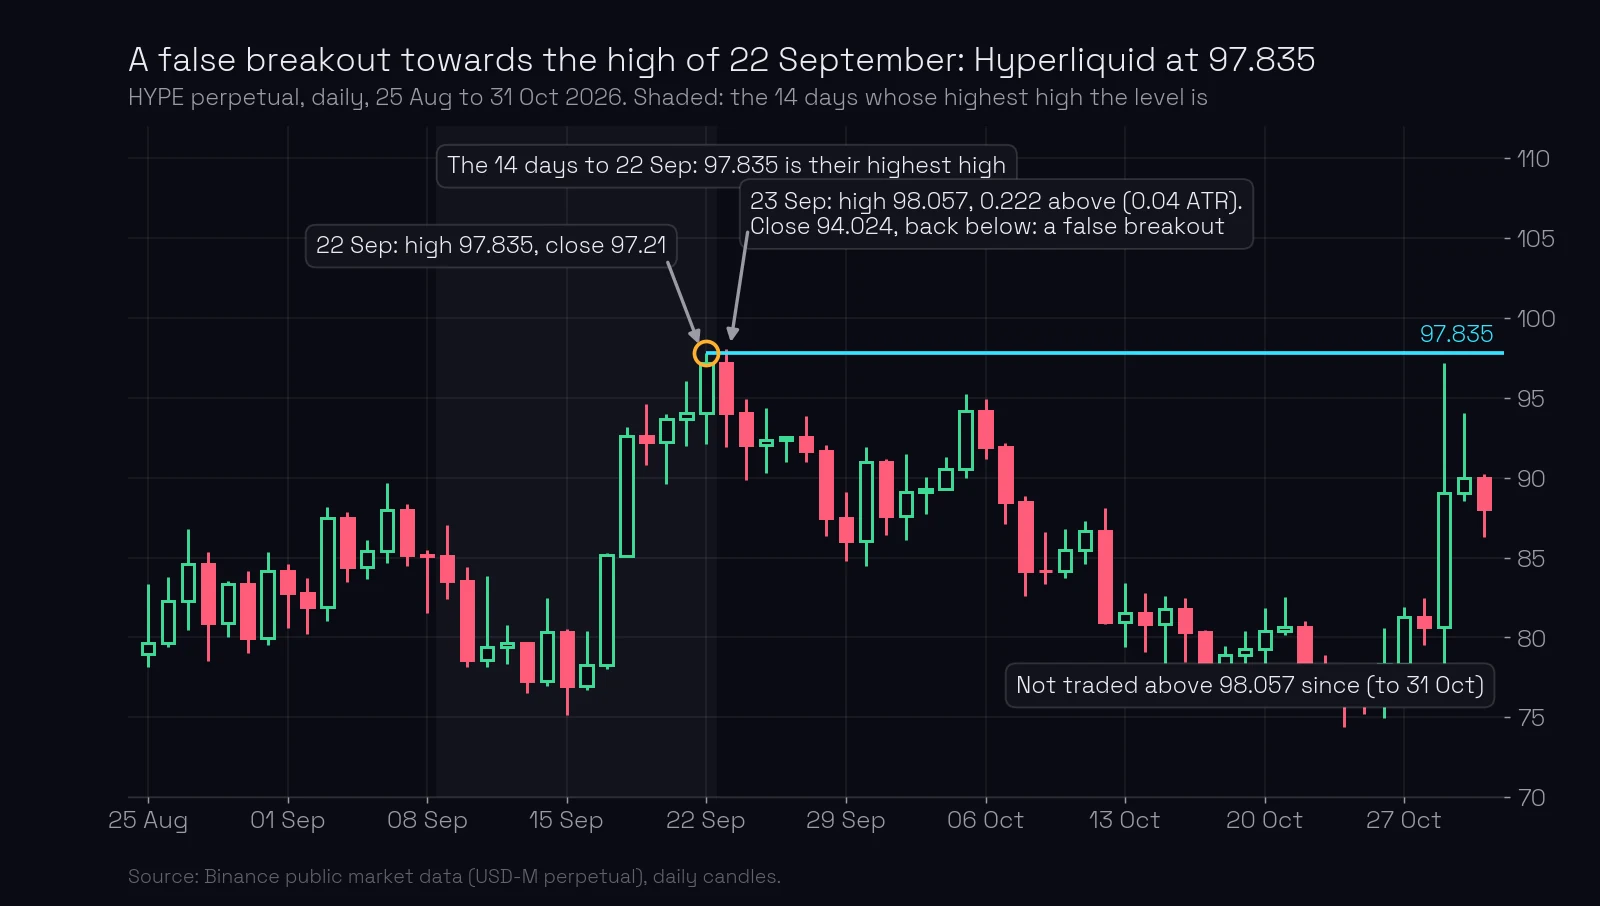
The same thing at a top. Hyperliquid’s contract rose to 97.835 on 22 September, the highest high of its trailing 14 days. On 23 September it traded up to 98.057, 0.222 above the high, and closed at 94.024, 3.81 below the level. The high was not updated. 97.835 became a false-breakout level, and the contract has not traded above 98.057 since (to 31 October). It is also a trend-change level: the 22 September high is the exact point where the rise stopped, and the failed candle is what stopped it.
The tail is not a level
A tempting mistake: to draw the level at the tip of the failed wick, at 2,172.85 on Ethereum or 98.057 on Hyperliquid. That is the one price the market just proved nobody holds. Price went there and came straight back. The tails of candles in false breakouts at extremes are not level material. The level is the price that was defended: the low or high that did not confirm.
What a false breakout does to a level
It makes the level stronger. False breakouts do not weaken the level; they make it more powerful. Everyone who sold the break of 2,230.20 on Ethereum is now losing money and has to buy back, and the big player who bought their selling is still there. A shallow failure, a wick a few percent of the ATR beyond the line, is one of the best signs a level can show (shallow false breakouts coming soon). A deep one, beyond a full ATR, is a different story and weakens it (deep false breakouts coming soon).
There is one more job for this type. A level that was sawed through, opened on one side and closed on the other, cannot be used again until it is reconfirmed, and a false breakout is the minimum reconfirmation (how a broken level gets reconfirmed coming soon).
You can see both levels on ChartThread: Ethereum’s daily chart and Hyperliquid’s. Each line starts at the candle that formed it.
What most traders miss. The failed candle is the loudest thing on the chart, so traders draw their level at its tip. The quiet candle before it, the one whose low or high was defended, is the level. The loud candle is a witness, not the event.
Common mistakes
- Drawing the level at the tip of the wick. Fix: the level is the violated high or low; the wick is evidence.
- Calling it before the close. Fix: a false breakout is decided by the close only. Wait for the candle to finish.
- Drawing one from every poke. Fix: the breached price must be a visible border, the lowest low or highest high of the recent days.
- Reading a false breakout as weakness. Fix: a shallow failure strengthens the level. Only a deep one weakens it.
Key takeaways
- A false breakout is a candle that trades beyond a high or low but closes back inside it: the price was not updated, because update means close.
- The violated high or low is the level, drawn from the candle that made it. The failed candle is the evidence.
- It is an after-the-fact level: it exists only once the failed candle has closed.
- It can only happen towards a visible border, not towards a candle in the middle of a range.
- The tail of the failed candle is not a level. A shallow false breakout makes the level stronger.
Lesson test · 7 questions
Check yourself
Can you pass on the first try?
Passing the test completes this lesson. Tests in a module open in order, each after the one before it. A first-try pass scores 100%. Each wrong answer costs 10 points, and every 10 wrong answers lock the test for 30 minutes. Once you pass, your score is final, except that a score of 50 or less can be retaken once.
-
What makes a breakout false?
-
Yesterday’s low was 2,230.20. Today traded down to 2,172.85 and closed at 2,243.60. Where is the false-breakout level?
-
Which candle is the level-forming candle of a false-breakout level?
-
Can you draw a false-breakout level while the breakout candle is still open?
-
Price pokes below yesterday’s low in the middle of a two-week range with lower lows a few days earlier, then closes back above. Why is this not a false-breakout level in this course?
-
On Hyperliquid, 22 September made a high of 97.835 and 23 September traded to 98.057 but closed at 94.024. What is the level and why?
-
What does a shallow false breakout do to the level it happened towards?
Free account
Take the test and keep your score
- Your answers are checked and every lesson you pass is marked complete.
- Your scores build into your course score, on any device.
- You come straight back to this question after signing up.
Next: level type 3, mirrored levels coming soon, when support becomes resistance.
Terms in this lesson
Related lessons
- How to find key levels: the candle that forms a level
- Level type 1: trend-change levels
- Shallow false breakouts make a level stronger coming soon
- Deep false breakouts weaken a level coming soon
- How a broken level gets reconfirmed coming soon
Educational content, not financial advice. Trading carries a risk of loss.