Long tails: why the longest wick makes the strongest level
A long wick is a move that was cancelled. Price went there, and within the same candle somebody pushed it all the way back.
The longer that tail, the stronger the price it stopped at.
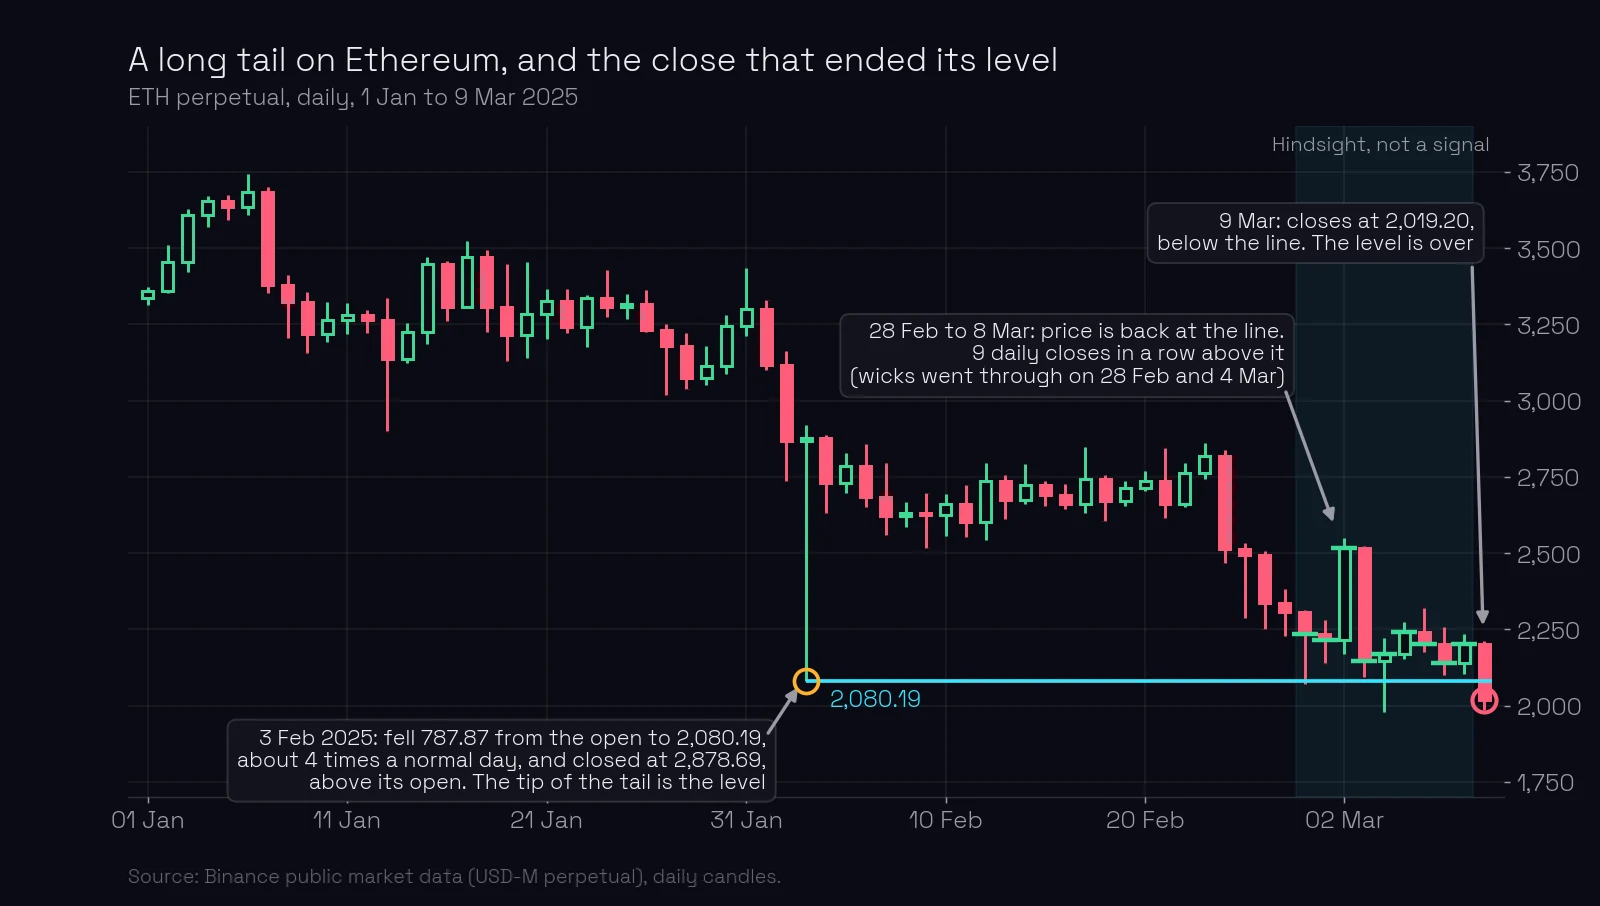
On 3 February 2025 Ethereum’s perpetual contract fell from 2,868.06 to 2,080.19, almost $800 in one day, about four times the average daily range of the previous 20 days, and closed at 2,878.69, above its open. The tail under the body is 787.87 points. Its tip, 2,080.19, is a level.
What you’ll learn
- What a long tail is, and what it says about the players at that price.
- Why the tip of the longest tail on a chart is a level.
- What a long tail that stops at an older level means.
- The one tail that is not a level: a shallow false breakout at an extreme.
- How ChartThread measures tails.
What a long tail is
A candle’s tail is the part of its range that is not in the body. On a daily candle, a tail is the distance between the low (or the high) and the nearer edge of the body. A long tail says that during the day price went to that extreme, and by the close it had been pushed far away from it.
That push does not happen by itself. When Ethereum traded at 2,080.19 on 3 February, every stop-loss below the market had been hit and every liquidation had been sold into the book. For the day to close almost 800 points higher, a buyer had to take all of that. A big player with limit orders at one price does exactly that: it absorbs what is sold to it and does not move.
So a long tail is the footprint of a strong limit player. The price where the tail stopped is where that player stood. The rule in this course: the longer the tail that stopped at a level, the better the level.
The tip of the longest tail is a level
The simplest case is the one above. The tail’s own tip is the level, because that is the exact price where the move was stopped. Draw the line at the low of the candle (or the high, for a tail on top), from that candle to the right (the candle that forms a level).
On Ethereum, price came back to 2,080.19 at the end of February. From 28 February to 8 March, nine days in a row, every daily close stayed above the line, even though wicks went through it on 28 February (2,070.00) and 4 March (1,979.99). On 9 March a candle closed at 2,019.20, below the line. That close ended the level: a level lasts only as long as the closes respect it.
One more thing the Ethereum tail shows: a false breakout can be the whole day. Price broke the lowest low of the previous twelve months, 2,112.00 from February 2024, and by the close the break had failed.
A long tail that stops at an old level
The stronger case is a long tail that stops at a level that already existed. Then two things confirm each other: the old level held, and it held against a big move.
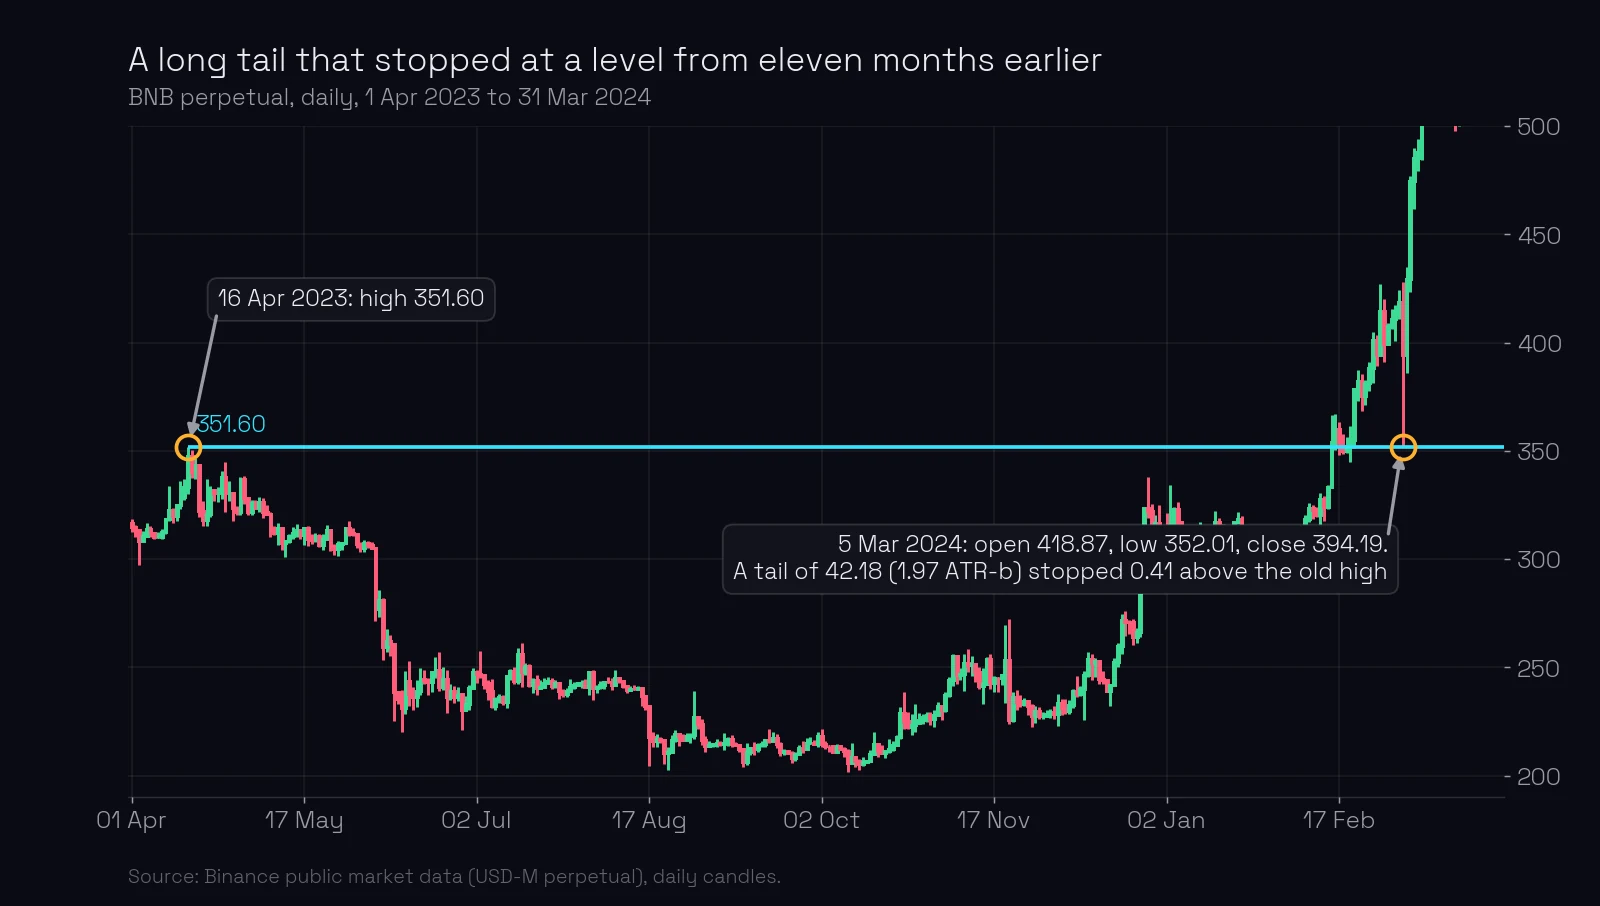
BNB’s contract made a high of 351.60 on 16 April 2023 and turned down. Eleven months later, on 5 March 2024, it fell from 418.87 to 352.01 inside one day and closed at 394.19. The tail is 42.18 points, 1.97 daily average true range (ATR), and it stopped 41 cents above the old high. The level had become support, a mirrored level (support becomes resistance), and the price that stopped the 2023 rise stopped the 2024 crash. Two days later BNB closed at 474.55, and by 6 June it traded at 723.20.
When you see this, you have a level with two footprints at the same number, months apart. That is as good as a line gets.
The tail that is not a level
Not every tail counts. At an extreme, a short poke beyond the previous low or high that is immediately bought or sold back is a false breakout of that extreme, and its tip is not a new level. The level is the extreme that was violated (the candle that forms a level).
The difference is depth. Ethereum’s tail went almost 800 points below the open, far beyond anything in the previous year: a move of its own, and its tip is the level. A tail that goes a few cents below yesterday’s low and comes back is a trap, not a move. The old low stays the level, and the trap confirms it (shallow false breakouts make a level stronger coming soon).
How ChartThread measures it
For every level on the chart, ChartThread records the longest tail that ever stopped at it, measured in the daily ATR of the day it happened. Measured that way, the Ethereum tail of 3 February 2025 is 3.01 daily ATR; the BNB tail at 351.60 is 1.97. The engine’s ATR leans on the five most recent normal days, and before 3 February those were busier than the 20-day average, so the same tail reads as about three ATR here and about four average days above. The number sits in the level’s evidence on the levels page, next to its touches and false breakouts, so you can see which lines have absorbed a big move and which have only been brushed.
The engine also draws the line between a level and a false breakout of it the way this lesson does: a spike shallower than half a daily ATR beyond a prior extreme is a false breakout of that extreme, and the extreme stays the level; a deeper spike is a move of its own, and its tip becomes the level.
How to use a long tail
- Find the longest tail on the daily chart, visibly longer than the days around it.
- Draw a line at its tip, from that candle to the right.
- Drop the line on the first daily close through it.
What most traders miss. A long lower tail on a red day looks like weakness: the market fell hard. Read the close instead. Price was at the low, and by the end of the day it was not. Someone bought everything that was sold down there, at one price, and that price now has an owner.
Common mistakes
- Reading the tail as the move and ignoring the close. Fix: the tail is the part that was cancelled; the close tells you who won the day.
- Drawing a level at every wick. Fix: a tail is a level when it is long, visibly longer than the days around it, measured in daily ATR.
- Calling a shallow poke beyond an extreme a new level. Fix: that is a false breakout; the violated extreme stays the level.
- Keeping the line after a close through it. Fix: one daily close beyond the tip ends the level, as on Ethereum on 9 March 2025.
- Forgetting the old chart. Fix: a long tail is strongest when it stops at a level that was already there, like BNB at 351.60.
Key takeaways
- A long tail is a move that was cancelled inside one candle: a strong limit player absorbed it at one price.
- The longer the tail that stopped at a level, the stronger the level.
- The tip of the longest tail on a chart is a level in its own right.
- A long tail that stops at an older level confirms that level with a second footprint.
- A daily close through the line ends the level.
- A shallow false breakout at an extreme is not a level; the violated extreme is.
Lesson test · 7 questions
Check yourself
Can you pass on the first try?
Passing the test completes this lesson. Tests in a module open in order, each after the one before it. A first-try pass scores 100%. Each wrong answer costs 10 points, and every 10 wrong answers lock the test for 30 minutes. Once you pass, your score is final, except that a score of 50 or less can be retaken once.
-
What is a long tail on a daily candle?
-
A daily candle opens at 50.00, falls to 41.00 and closes at 48.50. The daily ATR is 3.00. Where is the level and how long is the tail?
-
Why does a long tail point to a strong level?
-
On 3 February 2025 Ethereum opened at 2,868.06, fell to 2,080.19 and closed at 2,878.69. Which price is the level?
-
Yesterday’s low was 100.00. Today price dips to 99.80 and closes at 101.50; the daily ATR is 4.00. Is 99.80 a new level?
-
A long tail stops 0.41 above a high from eleven months earlier. What does that make the old high?
-
How does ChartThread record tails for a level?
Free account
Take the test and keep your score
- Your answers are checked and every lesson you pass is marked complete.
- Your scores build into your course score, on any device.
- You come straight back to this question after signing up.
Next: shallow false breakouts make a level stronger coming soon. On ChartThread’s levels page each level shows its longest tail in ATR, so you can see which lines have absorbed a big move.
Terms in this lesson
Related lessons
- Shallow false breakouts make a level stronger coming soon
- Touches to the cent: why precision matters
- Additional touches: when repeats confirm a level coming soon
- Near misses: candles that almost touch the level coming soon
- Deep false breakouts weaken a level coming soon
- What makes a level strong? The full checklist coming soon
Educational content, not financial advice. Trading carries a risk of loss.