Level type 3: mirrored levels, when support becomes resistance
A level that stopped a fall can later stop a rise, at the same price. Traders say support became resistance. In this course it is a mirrored level.
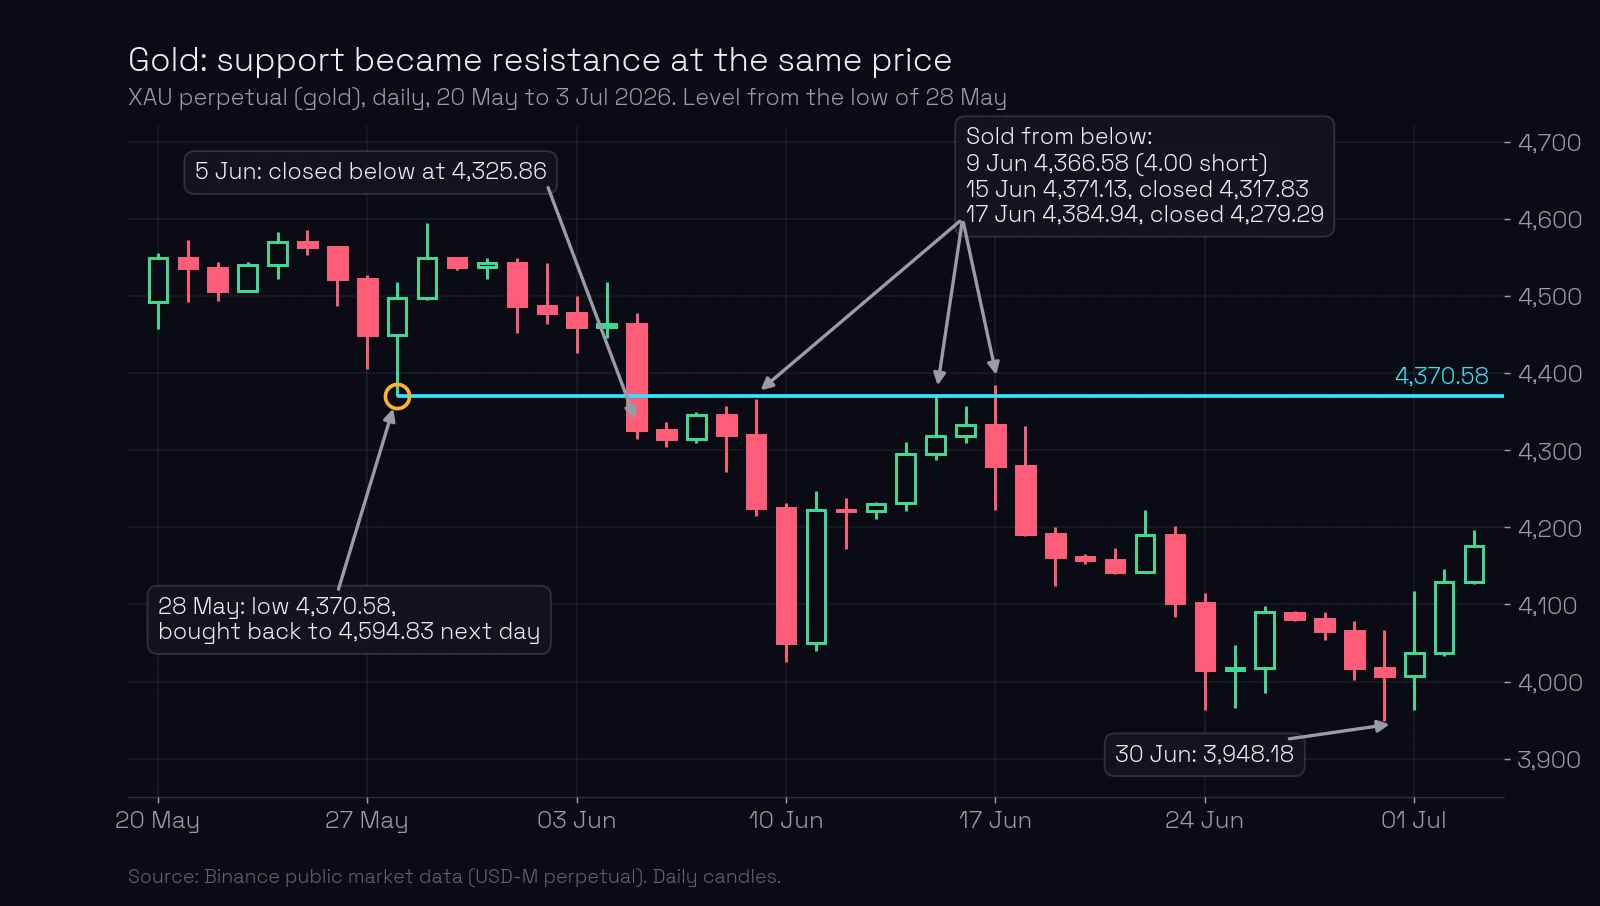
Gold’s perpetual contract was bought at 4,370.58 in May. In June the same price stopped it three times from below.
What you’ll learn
- What a mirrored level is, and what it tells you about the players.
- How to read one on a real chart, touch by touch.
- Why the daily chart must not contradict the picture on lower timeframes.
- Why mirrored levels are better taken from higher timeframes.
What is a mirrored level?
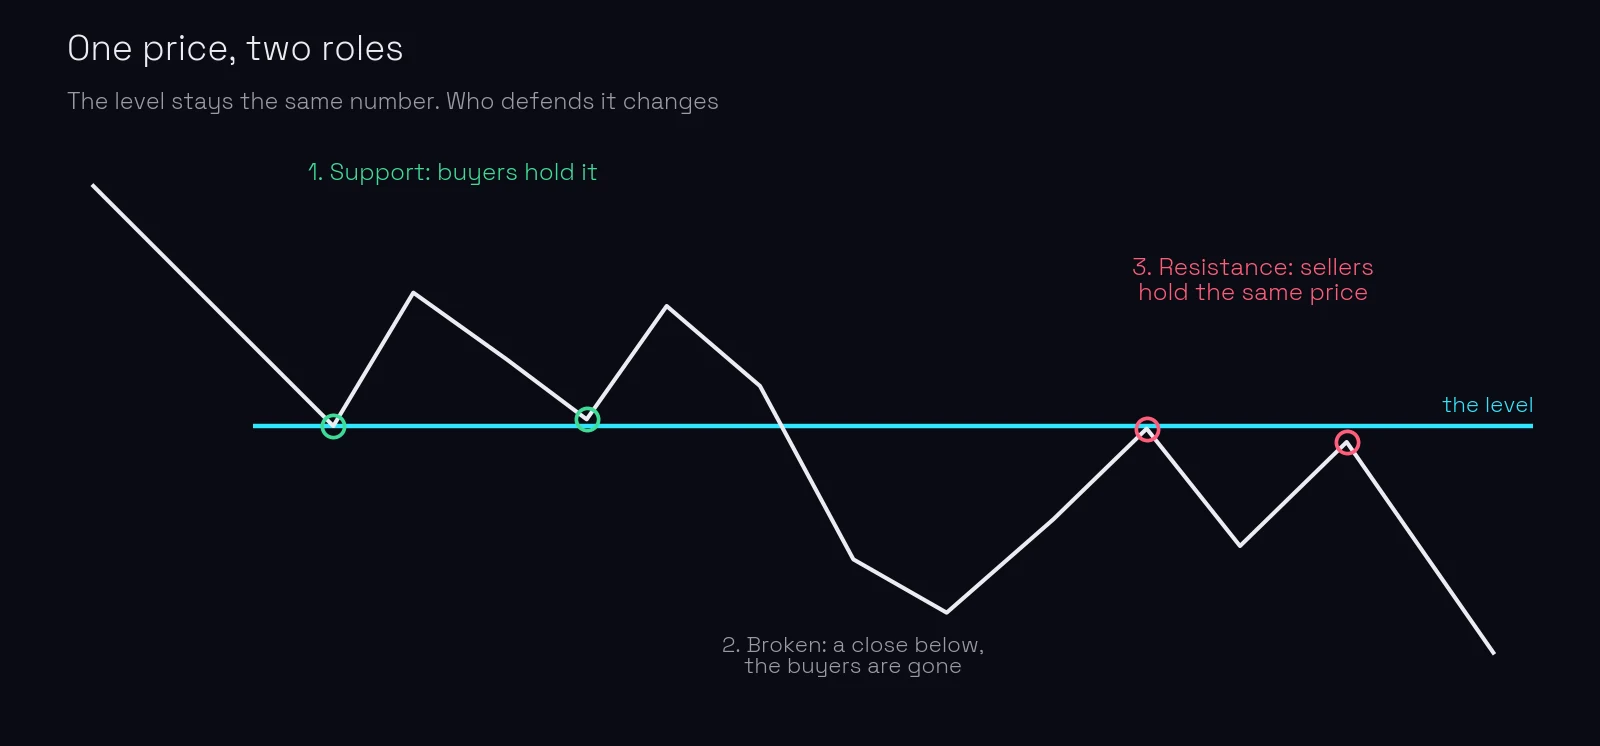
A mirrored level is one exact price that worked from both sides. First it held price from one side: a fall stopped there (support) or a rise stopped there (resistance). Then price closed through it, and later the same price held it from the other side.
The level does not move. It stays the number taken from the high or low of the candle that formed it (the candle that forms a level). What changes is who defends it.
Why a level changes sides
When resistance becomes support, or the other way round, the balance of power between players has changed. The author also calls it the level of players’ power change.
At the first touch, a big player was buying at that price with limit orders, so price could not go lower. When price closes below the level, that buyer is filled or gone, and sellers are now stronger. When price comes back up to the same price, it meets sellers there: traders who bought at the level and want out without a loss, and players who now sell at it.
A mirrored level is the chart showing you that change. One side held the line; now the other side holds the same line.
Check the daily chart first
When you move to a lower timeframe, for example from the 1-hour chart to the 5-minute chart, the daily chart should not contradict the picture. A mirrored level is a daily level. The 1-hour chart shows how price approaches it, not whether the level exists (why levels come from the daily chart).
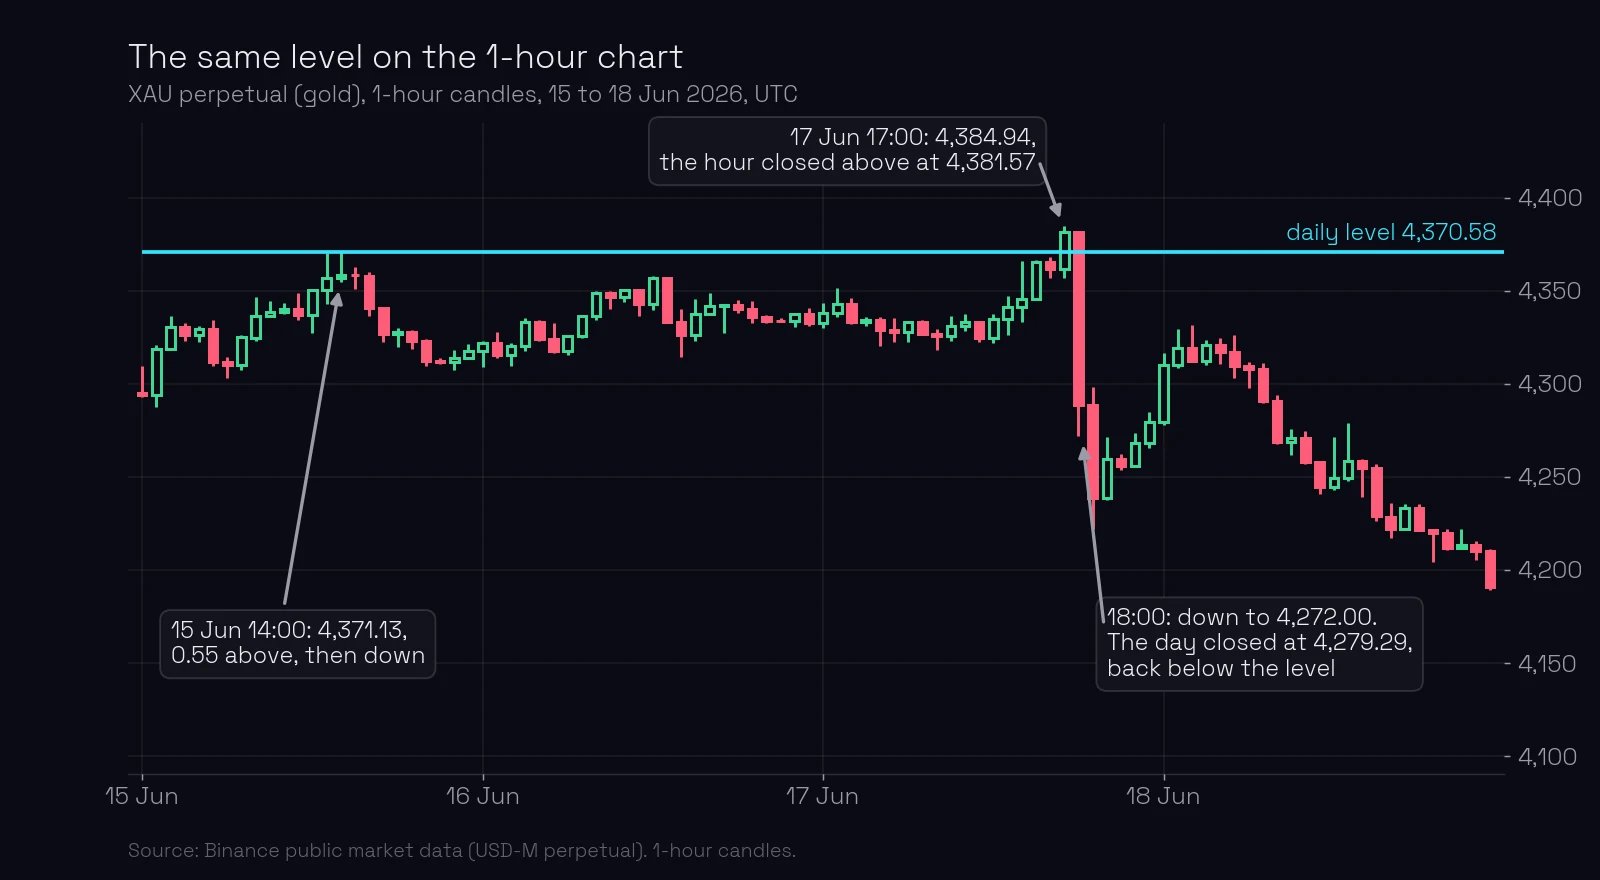
On the 1-hour chart of 17 June, gold rose to 4,384.94 and one hourly candle closed above the level, at 4,381.57. On that chart alone it looked like a breakout. The next hour fell to 4,272.00, and the daily candle closed at 4,279.29, below the level. On the daily chart the day was a false breakout towards 4,370.58, and false breakouts do not weaken a level; they make it stronger.
This is what “the daily chart should not contradict the picture” means in practice. The charts of different timeframes must agree before you trade. If the daily chart shows the prerequisites for a breakout, but the 1-hour or 4-hour chart shows price better placed for a bounce or a false breakout, the timeframes do not agree, and there is no trade. On 17 June the hourly chart showed a close above the level, while the daily chart showed sellers holding it from below: a contradiction, so the hourly “breakout” was not a signal.
Better from higher timeframes
Mirrored levels are better taken from higher timeframes. Levels in this course come from the daily chart, and a level that changed sides on the weekly or monthly chart is better still: more players see the higher timeframe, so more of them act at its levels. A “mirror” that exists only on the 1-hour chart is just a turn.
Example: gold’s 4,370.58, step by step
- The level forms. On 28 May the XAU perpetual fell to 4,370.58 and closed at 4,497.85. The next day it reached 4,594.83, 224.25 above the low, about 3 daily ATR (the ATR was 75.77). Buyers held this price.
- The break. On 5 June price closed at 4,325.86, below the level. The buyers were gone.
- First touch from below. On 9 June price rose to 4,366.58, 4.00 short of the level, and closed at 4,224.97. The next day it fell to 4,025.67.
- Second and third touches. On 15 June it went 0.55 above, to 4,371.13, and closed back below at 4,317.83. On 17 June it went 14.36 above, to 4,384.94, and closed at 4,279.29. Both were shallow false breakouts: 0.55 and 14.36 against a daily ATR of 99.19 and 96.01.
- The stop. The course places the stop 10% of the daily ATR beyond the level. On 17 June that was: so a stop at 4,370.58 + 9.60 = 4,380.18. The day’s high, 4,384.94, went beyond it. The level held on the daily close, but a short trade with that stop would have been stopped out. A false breakout can take a short stop even when the level survives (shallow false breakouts coming soon).
- What followed. By 30 June gold was at 3,948.18, 9.7% below the level.
- Later. On 10 August price closed above 4,370.58, at 4,407.18, and through August and September it crossed the level again and again with closes on both sides. It was sawed through, and it cannot be used until it is confirmed again (sawed-through levels coming soon).
What most traders miss. A broken level is not deleted. Beginners erase a support line the moment price closes below it, and then they are surprised when the rally stops at “nothing”. The level is still on the chart, with a new owner. Keep broken levels drawn, and watch what price does when it comes back to them from the other side.
Common mistakes
- Moving the level after the break. Fix: the mirrored level is the same exact number, taken from the original candle.
- Calling every retest a mirror. Fix: price must first close through the level; a poke that closes back is a false breakout, not a break.
- Trusting a mirror seen only on a lower timeframe. Fix: check the daily chart first; it must not contradict the picture.
- Expecting a mirrored level to hold forever. Fix: if it gets sawed through, stop using it until it is reconfirmed.
Key takeaways
- A mirrored level is one exact price that held from one side and later from the other.
- It shows that the balance of power between players has changed.
- The daily chart must not contradict what you see on lower timeframes.
- Mirrored levels are better taken from higher timeframes.
- Gold’s 4,370.58 held as support on 28 May, broke on 5 June, and stopped price from below on 9, 15 and 17 June.
Lesson test · 7 questions
Check yourself
Can you pass on the first try?
Passing the test completes this lesson. Tests in a module open in order, each after the one before it. A first-try pass scores 100%. Each wrong answer costs 10 points, and every 10 wrong answers lock the test for 30 minutes. Once you pass, your score is final, except that a score of 50 or less can be retaken once.
-
What is a mirrored level?
-
What does a mirrored level tell you about the market?
-
A low at 4,370.58 held in May. On 5 June price closed at 4,325.86. Where is the mirrored level now?
-
Price goes 0.55 above a mirrored resistance and closes back below. How do you read it?
-
On the 1-hour chart one candle closes above a daily mirrored level, but the day closes back below it. What do you check?
-
Price comes up to a mirrored resistance at 4,370.58 and you go short. On that day gold’s daily ATR is 96.01. Where is a stop 10% of the ATR beyond the level?
-
Which mirrored level is better?
Free account
Take the test and keep your score
- Your answers are checked and every lesson you pass is marked complete.
- Your scores build into your course score, on any device.
- You come straight back to this question after signing up.
Next: level type 4, limit-player levels coming soon. Find gold’s levels, broken ones included, on ChartThread’s levels page.
Terms in this lesson
Related lessons
- Best timeframe for support and resistance: the daily chart
- Shallow false breakouts make a level stronger coming soon
- Sawed-through levels: when a level is used up coming soon
- How a broken level gets reconfirmed coming soon
- Change of polarity: candles at a mirrored level coming soon
Educational content, not financial advice. Trading carries a risk of loss.