Foundations · Lesson 33 of 33
Foundations recap: what you know now
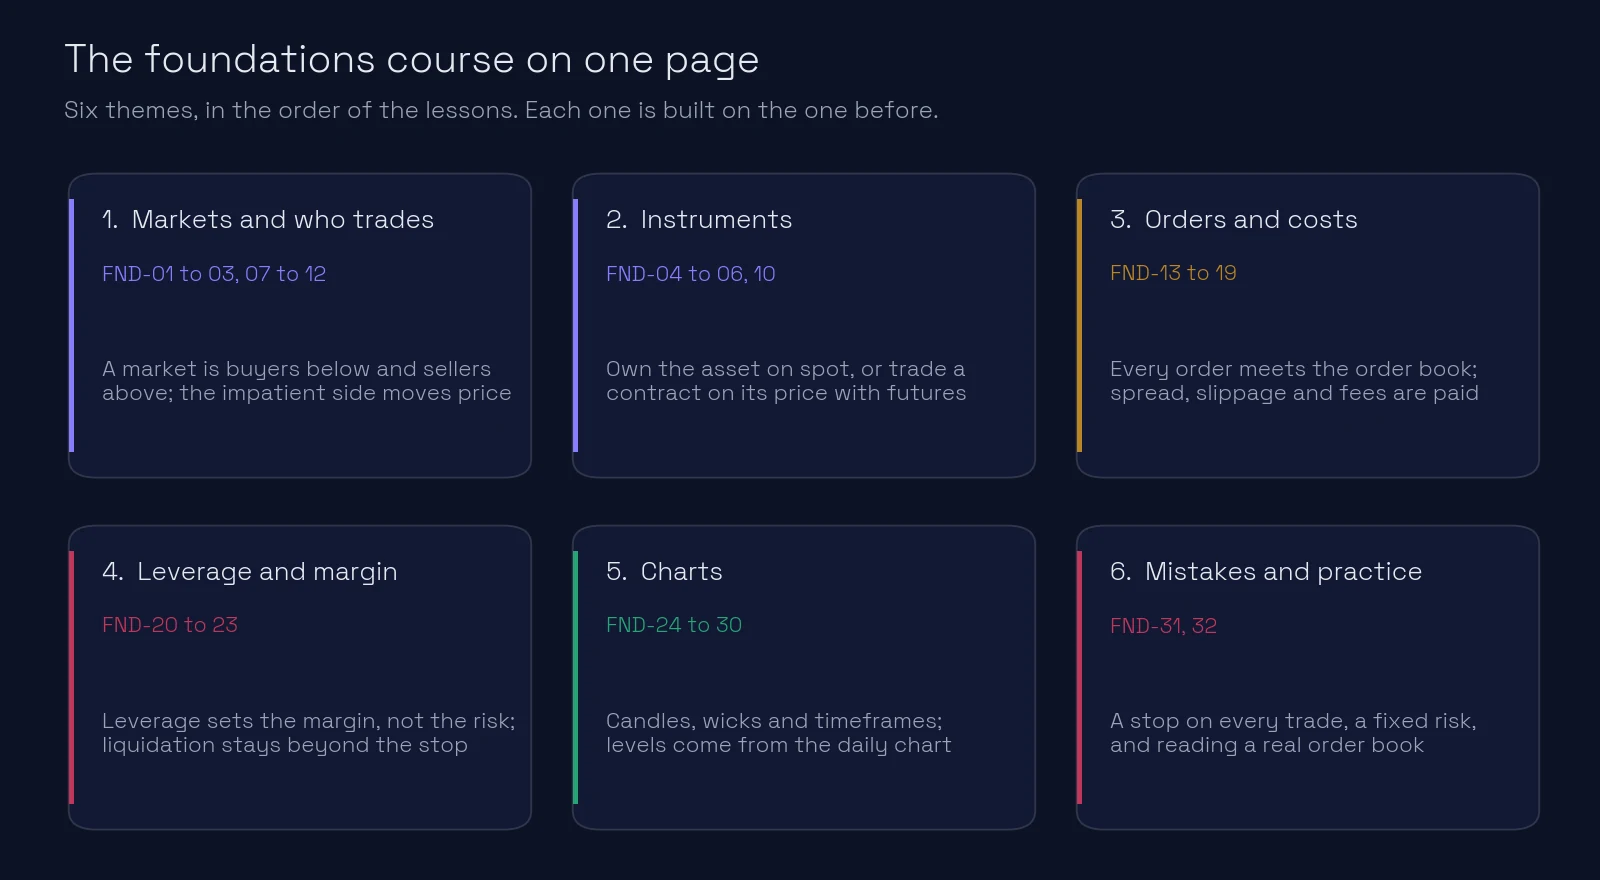
You have worked through the foundations: what a market is, what you can trade, how orders get filled, what leverage really does, how to read a chart and which mistakes empty accounts. This lesson puts it all on one page, so you can see how the pieces fit before you move on to levels.
If something here feels unfamiliar, follow the link back to its lesson. That is what this page is for.
What you’ll learn
- The few ideas from each part of the course that you will use in every trade
- How they connect: from the order book to the stop on your chart
- Where to go back if one of them is still unclear
What is a market, and who moves the price?
A market is two queues: buyers waiting below the price and sellers waiting above it. The price is simply the last trade between them. It moves when one side gets impatient and crosses over to the other, and it moves fastest where few orders are waiting. See what is a market.
An exchange runs that queue for one instrument and matches orders by price, then by time. Every exchange is its own market, so the same instrument trades at slightly different prices on different venues. Crypto exchanges never close; stock exchanges have sessions, and a closed market can open with a gap through your stop. See which markets exist.
Every trade has a buyer and a seller, but they are not all the same kind of player. Long buyers and short sellers open positions; long sellers and short buyers close them. A short buyer who is losing must buy, whatever the price, which makes them the most aggressive buyers of all. See the four market players and what happens at a level.
How long you hold a trade decides your style: scalping, day trading, swing or position trading. Pick the one that fits your time and temperament. Shorter styles pay the same costs on much smaller moves. See types of trading and which one you are.
What are you actually trading?
An instrument is the form in which you trade a market. On spot you pay in full and own the asset; nobody can close you out. A futures contract is an agreement on the price, with margin, leverage and easy shorting. See classes of instruments.
On crypto exchanges most trading happens in perpetual futures: futures with no expiry date. Funding payments between longs and shorts keep their price close to spot. Perpetuals now exist on shares and commodities too, not only on crypto.
A long position profits when price rises; a short position profits when it falls. Every position ends with the opposite trade, so a crowded short has to buy back, and that buying can turn a rally into a squeeze. See long and short and short selling.
How does an order get filled, and what does it cost?
The order book lists every waiting order: bids below, asks above. The gap between the best bid and the best ask is the spread. A market order crosses it and fills against waiting orders, best price first. A limit order waits in the queue at your price, with no guarantee of a fill. See bid and ask, the spread and how the order book works.
There are four basic orders: market, limit, stop and stop-limit. A stop is a market order that waits for a price; a stop loss is the stop that closes a losing trade. See types of orders.
Every trade has costs:
- The spread, paid each time you trade with a market order.
- Slippage, the gap between the price you expected and the price you got. It grows with your size and with how thin the book is. See slippage.
- Fees. Makers, whose orders wait in the book, pay less than takers, who trade at once. Fees are charged on the whole position, not on your margin. See maker and taker fees.
Liquidity is how much is waiting close to the price. A deep book absorbs big orders; a thin one jumps. Stops sitting under obvious lows and above obvious highs are pools of liquidity that price is often drawn to. See liquidity.
What does leverage really change?
Leverage is the position divided by the margin. It changes how much money you lock up and how close liquidation sits. It does not change your risk: the loss on a trade is the size times the stop distance, and leverage is not part of that.
Two rules keep you safe:
- Use isolated margin by default, so one trade can only lose its own margin, never the whole balance. See isolated vs cross margin.
- Keep the liquidation price beyond your stop. If it sits between your entry and your stop, the exchange closes the trade before your plan does. Lower the leverage until it doesn’t. Liquidation uses the mark price, not the last trade. See how to never get liquidated.
On perpetuals, funding is paid at fixed times on the full position value. Small rates add up, and leverage makes them large compared with your margin.
How do you read a chart?
Every chart is built from four prices per period: open, high, low and close. Line charts show only the closes; bars and candles show all four. See types of charts, how to read a candle and bars vs candles.
A long wick is price that traded and was rejected before the close. In empty space it means little. At a level, it shows someone defending that price. See what a long wick means.
Each timeframe has its own job. The daily chart gives the levels and the direction. The 1-hour chart shows how price behaves near a level. The 5, 15 or 30-minute chart gives the entry point. See timeframes explained.
Use a log scale when the chart covers a big range of prices, such as years of Bitcoin; for a day or a week either scale works. Levels are exact prices and stay put when you change the scale. See linear or log.
A chart is one venue’s trades. Take your levels from the exchange and the market you actually trade, and place orders on the exchange you trust. See which chart to trust.
Which mistakes should you avoid from day one?
Losses compound: lose half the account and you have to double the rest to get back. So the first job is to keep every loss small. See the most common mistakes.
- A stop on every trade, decided before you enter, placed behind the level.
- A fixed risk per trade. Choose your risk per trade, such as 1% of the account, and size the position from the stop.
- Never add to a losing trade. If the stop is hit, the idea was wrong.
- Count the costs and trade only your setup, not because you are at the screen.
Then practise reading a real book: find the spread, the walls, and how far a market order would move the price. See read your first order book.
Where do these ideas meet on ChartThread?
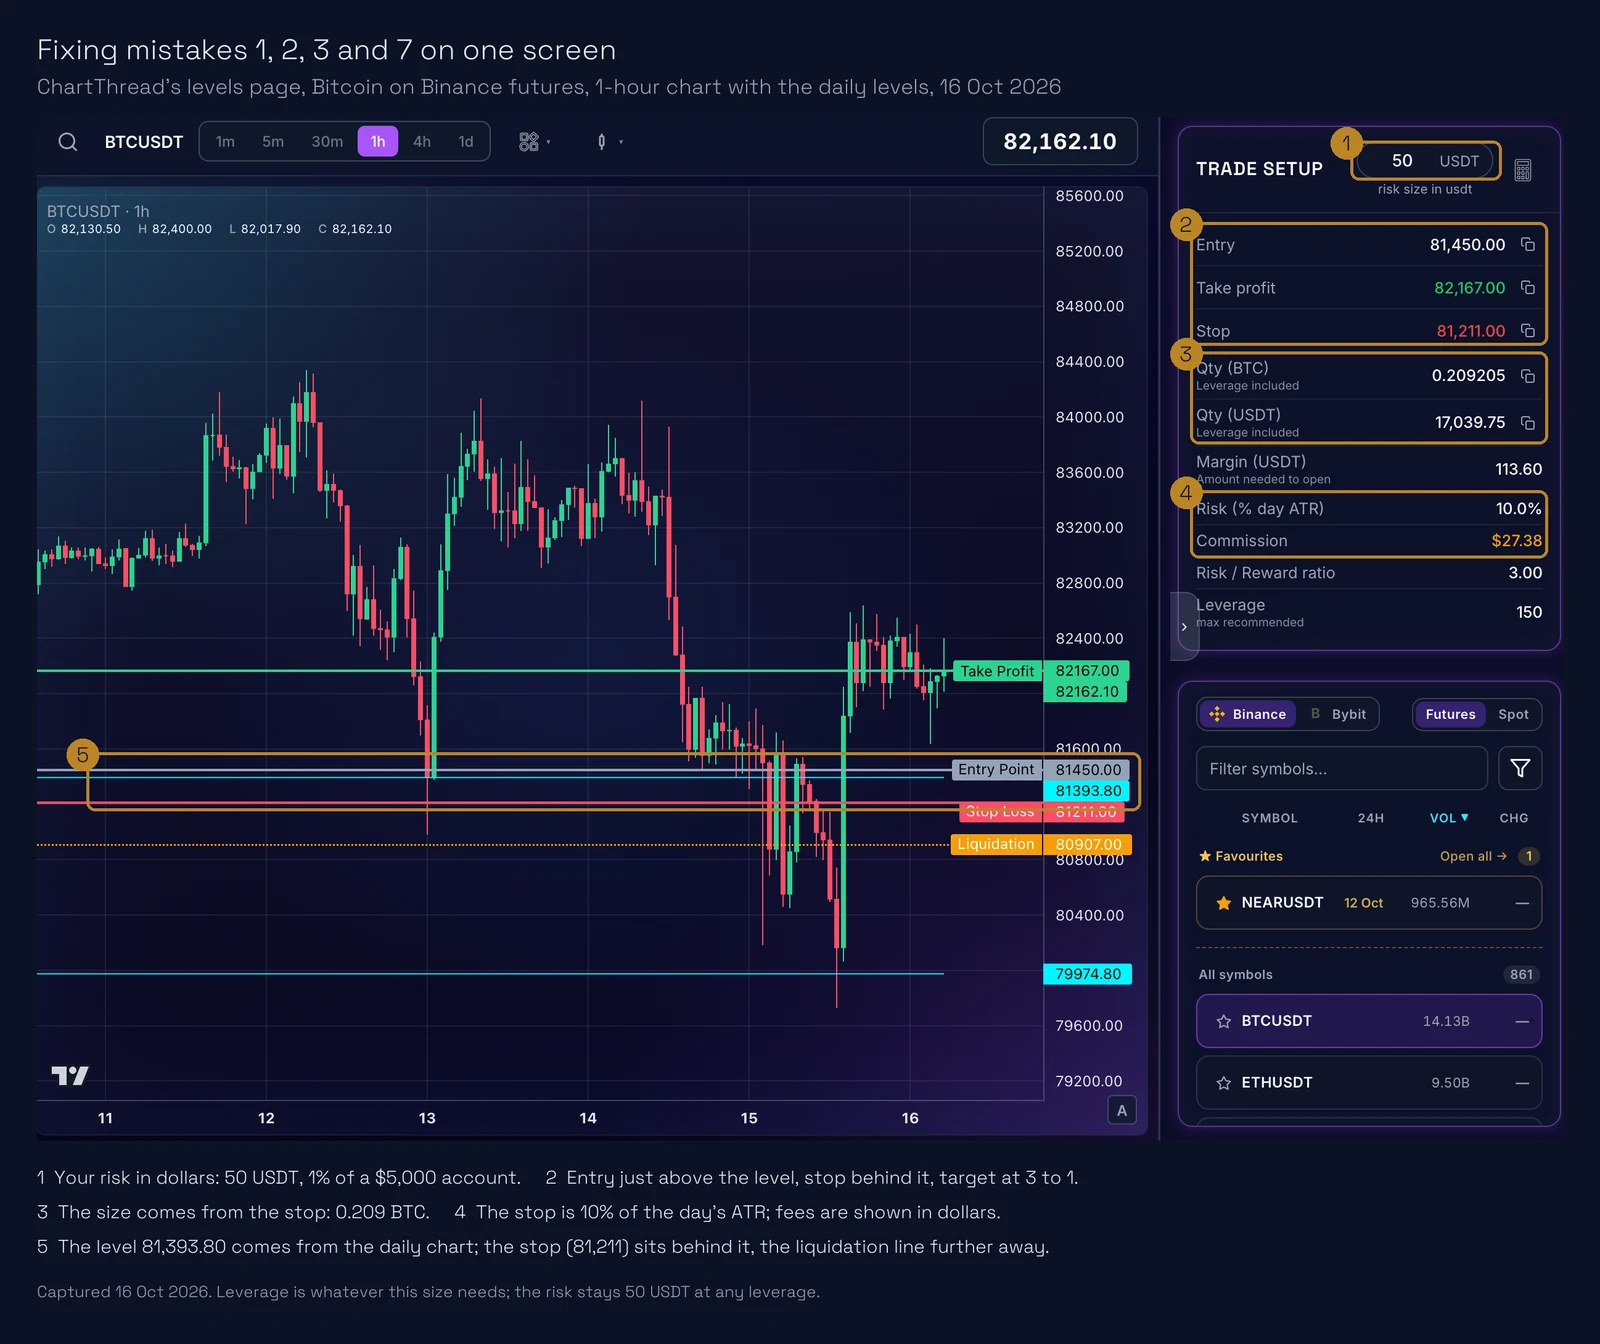
ChartThread’s levels page brings much of this course together on one screen. You pick the exchange and the market, spot or futures. The levels come from the daily chart, and you watch them on the timeframe you choose. In the trade setup you type your risk in dollars; it places the stop behind the level from the daily ATR, works out the size, and shows the leverage and liquidation price that size needs.
What most traders miss.
The basics are not a stage you leave behind. Spread, slippage, fees, liquidation and timeframes come up in every trade you will ever take. Traders with years of experience still lose money on them.
Risk lives in the size, not in the leverage. If you remember one idea from this course, make it this one: the stop and the size decide what you can lose.
How do you get the foundations certificate?
Pass the test of every foundations lesson with a score above 50 on each. This recap has no test of its own. You can then claim the ChartThread foundations certificate: a badge on your learning profile and a PDF with your name, issued by ChartThread, confirming that you completed the foundations course.
Missed one? Your progress on the course page shows which lessons still need a test.
Key takeaways
- A market is buyers below and sellers above; the price moves when one side gets impatient.
- Spot means you own the asset; futures and perpetuals are contracts on its price, with margin and funding.
- Every trade pays the spread, slippage and fees, and they matter more the smaller your stop.
- Leverage sets the margin and the liquidation price, not your risk. Keep liquidation beyond the stop.
- Levels and direction come from the daily chart; the 1-hour chart shows behaviour, the small charts give the entry.
- A stop on every trade and a fixed risk per trade keep you in the game long enough to learn the rest.
Check yourself
What actually moves the price?
Impatience. When buyers are in a hurry, they take the sellers’ asks and the price goes up; when sellers are, they hit the bids and it goes down. See what is a market.
You raise the leverage but keep the same size and stop. What changes?
Less margin is locked and liquidation moves closer. Your risk stays the same, because it is size times stop distance. Check that liquidation still sits beyond the stop.
Which chart gives you the levels?
The daily chart. The 1-hour chart shows how price behaves near a level, and the 5, 15 or 30-minute chart gives the entry point.
Next: the four pillars of a trade. To see today’s levels for the exchange and market you trade, open ChartThread’s levels page.
Course certificate
Earn the ChartThread Foundations certificate
Pass every foundations lesson test with a score above 50, and ChartThread issues you a certificate with your name: a badge on your learning profile and a PDF you can download and share.
Related lessons
Educational content, not financial advice. Trading carries a risk of loss.