Level type 6: IPO and listing levels
A new instrument has no history. Its first candle is the only event on the chart, and everyone who traded that day remembers it.
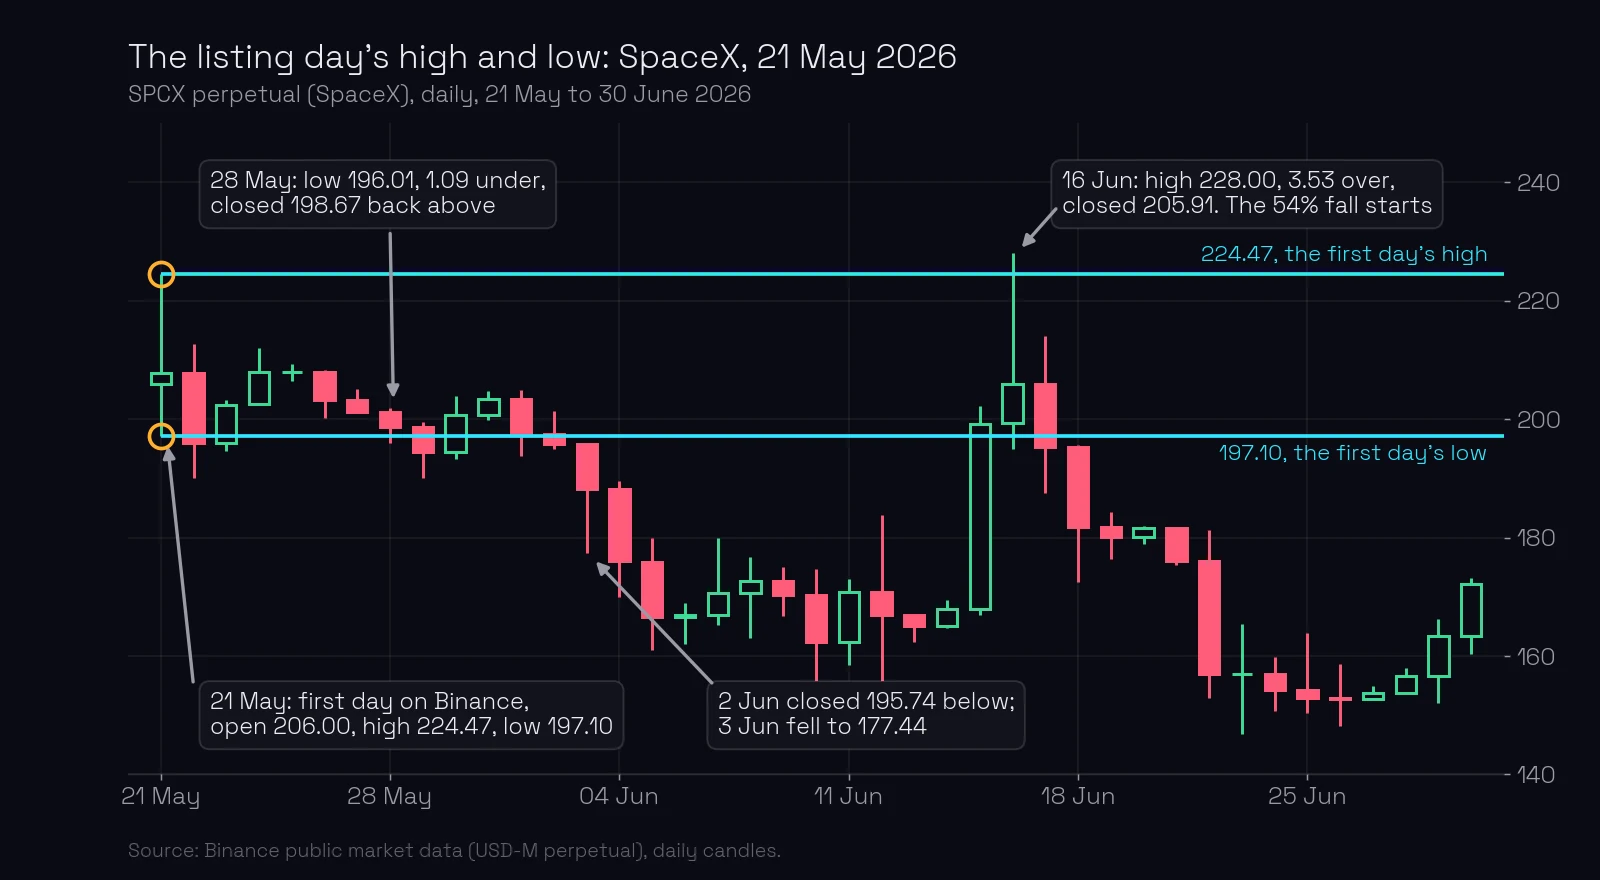
That is why the high and the low of the first candles are the sixth level type: the IPO level.
What you’ll learn
- Which two prices of an IPO or a listing are levels, and why they hold.
- What “the levels around the IPO date” means on a perpetual contract.
- How the first-day high ended SpaceX’s rise, and how Anthropic’s first-day levels flipped sides.
- What to do when a listing level is broken.
What is an IPO level?
An IPO is the day a company’s shares start trading. On that day the price has no past: no old highs, no old lows, no historical levels. The only events on the chart are the ones the first candles make.
The rule has two parts:
- The high and the low of the IPO candles are powerful levels. The level-forming candle is the first day; the levels are its exact high and its exact low (the candle that forms a level).
- All levels around the IPO date are powerful levels. The turns of the first days and weeks, before the chart has any other memory, carry more weight than a turn of the same size a year later.
The reason is simple. On the first day the whole market buys and sells inside one range. Everyone who was in it knows exactly where the top and the bottom were. A buyer from the first hour who is losing money watches the first-day low; a seller who sold the first-day high watches that high. When price comes back, they act.
On ChartThread you trade perpetual contracts. A perpetual on a stock is listed by the exchange, sometimes long after the company’s IPO, so the first candle of the contract is the listing day, not the IPO day. The same rule applies to it: the first day a contract trades is the first event in its history, and its high and low are the levels. In this course both are called IPO levels; on the charts below they are listing levels.
SpaceX: the first day’s high ends the rise
The SpaceX contract started trading on Binance on 21 May 2026. It opened at 206.00, traded up to 224.47 and down to 197.10, and closed at 207.76. A range of 27.37, almost 14% of the price, in one day.
Those two prices are the levels. Look at what they did.
The low, 197.10. On 28 May price fell to 196.01, 1.09 under the level, and closed the day at 198.67, back above it: a false breakout of the listing low. The level held. On 2 June the contract closed at 195.74, below the level, and on 3 June it fell to 177.44. Once a level is closed through, it is broken and needs a reconfirmation before you use it (how a broken level gets reconfirmed coming soon).
The high, 224.47. On 16 June price rose to 228.00, 3.53 over the first-day high, and closed at 205.91, far below it. The daily average true range that day was 15.53, so the poke above the level was 0.23 ATR: a false breakout of the listing high. That day was the top. From 228.00 the contract fell 54% to 104.31 on 3 August, the trend-change level you saw in level type 1.
The listing high did exactly what the rule says. The first-day sellers were still there four weeks later, and the attempt to go above them failed on the same day.
Anthropic: five months on the same two prices
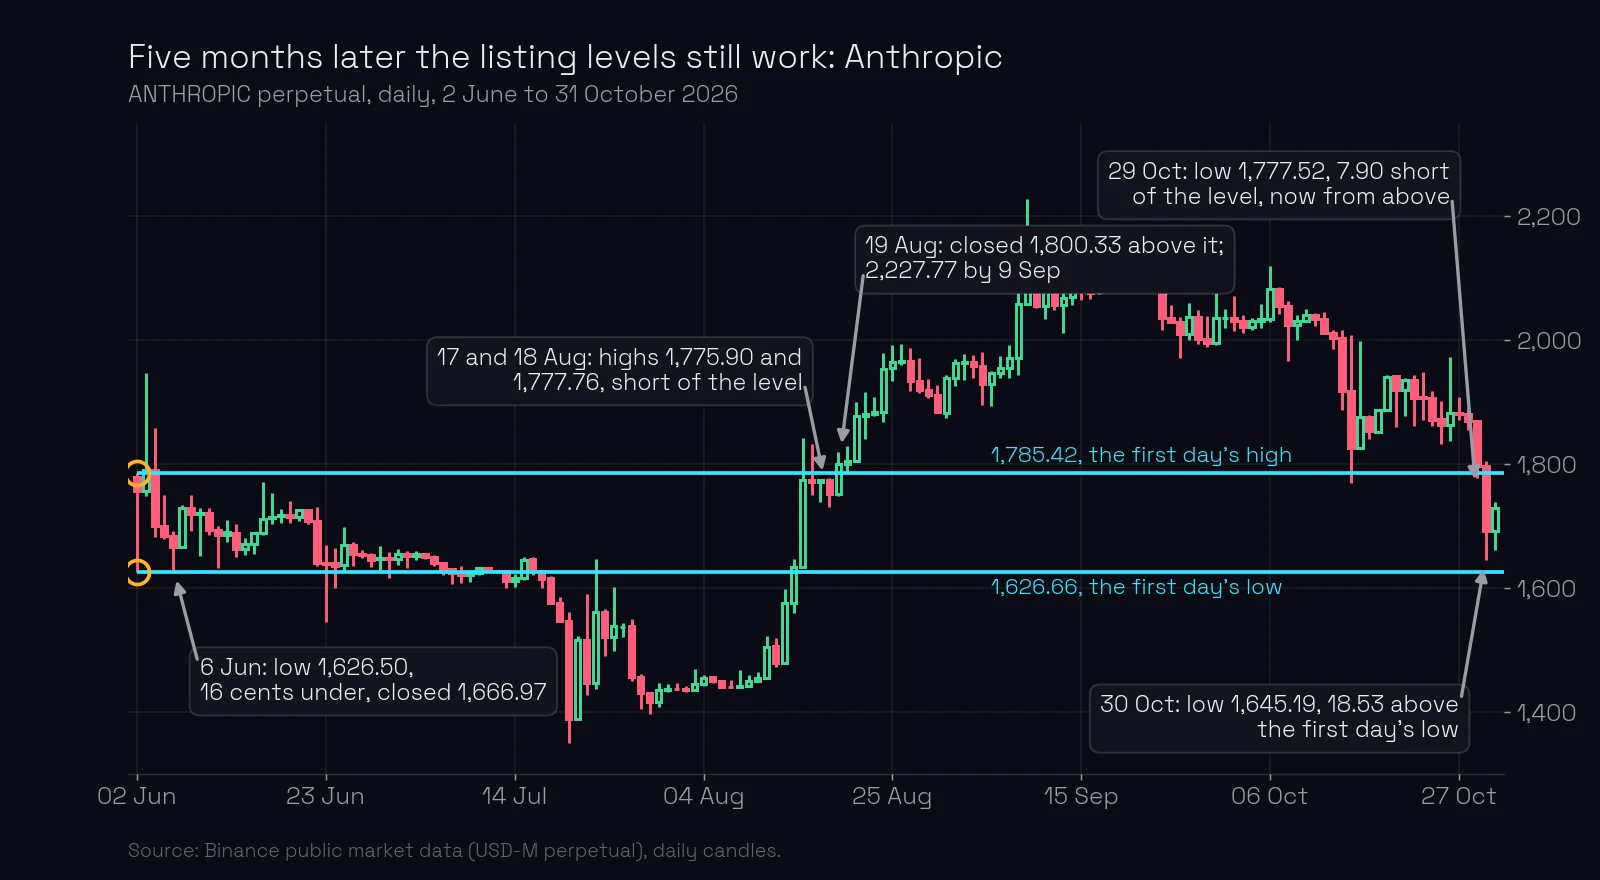
The Anthropic contract’s first day was 2 June 2026: high 1,785.42, low 1,626.66.
- 6 June. Four days later the low was tested: 1,626.50, 16 cents under the level, and the day closed at 1,666.97. A touch to the cent, in effect, and a hold.
- 17 and 18 August. Ten weeks later price came up to the first-day high and stopped at 1,775.90 and 1,777.76: 9.52 and 7.66 short of 1,785.42. Two days of near misses under the level.
- 19 August. The contract closed at 1,800.33, above the high. The level was broken upwards, and the move ran to 2,227.77 by 9 September.
- 29 October. On the way down, the fall stopped at 1,777.52, 7.90 above the old first-day high. The level that had been resistance was now support: a mirrored level made from the listing high.
- 30 October. The next day price closed through it and fell to 1,645.19, 18.53 above the first-day low, which was waiting underneath.
Five months after the listing, the two prices of the first candle were still the prices the market stopped at.
How to use a listing level
- Mark the first candle. Open the daily chart and find the first bar the contract ever printed. Take its exact high and low.
- Draw both from the first day to the right. They are drawn from left to right like every other level (how to draw a level).
- Treat the first weeks’ turns as strong. A reversal that happens inside the first weeks is a level around the IPO date, and it counts more than its size suggests.
- Trade from them with a short stop. On SpaceX on 16 June the daily ATR was 15.53, so a stop of 10% of the ATR was 1.55. Price went 3.53 over the level before turning, so a stop placed right at the level would have been taken; placed a little above the high of the day it was not. The level gives you the place; the stop size comes from the ATR.
- Respect a break. When a close goes through the level, as SpaceX’s 2 June close did, the level is gone until it is reconfirmed.
You can check both charts on ChartThread: SpaceX and Anthropic.
What most traders miss. On a new instrument there are no old levels to lean on, so traders draw nothing and wait. The first day is the level. Its high and low are the only two prices every participant has in common, and that is what makes a level work.
Common mistakes
- Taking the IPO price instead of the IPO candle. Fix: the level is the high or the low the market actually printed, not the price the company sold shares at.
- Ignoring the first weeks because the chart “has no history”. Fix: the first weeks are the history. Their turns are levels around the IPO date.
- Keeping a listing level after a close through it. Fix: SpaceX’s 197.10 was broken by the 2 June close. A broken level needs a reconfirmation.
- Drawing the level on the 1-hour chart. Fix: levels come from the daily chart (the daily chart); the first daily candle is the forming candle.
Key takeaways
- The high and the low of the IPO or listing candles are powerful levels, and so are the turns in the first weeks.
- On a perpetual contract the first day of trading plays the role of the IPO day.
- SpaceX’s first-day high, 224.47, stopped the rise four weeks later: 228.00 on 16 June, then a 54% fall.
- Anthropic’s first-day levels held on 6 June, stopped price in August, flipped to support on 29 October and caught the fall on 30 October.
- A close through a listing level breaks it; use it again only after it is reconfirmed.
Lesson test · 7 questions
Check yourself
Can you pass on the first try?
Passing the test completes this lesson. Tests in a module open in order, each after the one before it. A first-try pass scores 100%. Each wrong answer costs 10 points, and every 10 wrong answers lock the test for 30 minutes. Once you pass, your score is final, except that a score of 50 or less can be retaken once.
Tests in a module open in order. Pass the test of the previous lesson first: Level type 5: historical levels. You can still read the questions here.
-
Which prices of an IPO or a listing are levels?
-
On a perpetual contract for a stock, which day plays the role of the IPO day?
-
SpaceX’s first day on Binance printed a high of 224.47. On 16 June price reached 228.00 and closed at 205.91. How does the course read that day?
-
SpaceX’s first-day low was 197.10. On 2 June the contract closed at 195.74. What is the state of the level?
-
Anthropic’s first-day high was 1,785.42. On 29 October a fall stopped at 1,777.52. What is that?
-
Why do the first day’s high and low keep working for months?
-
The daily ATR is 15.53 and the listing high is 224.47. In this course, how big is one stop above the level?
Free account
Take the test and keep your score
- Your answers are checked and every lesson you pass is marked complete.
- Your scores build into your course score, on any device.
- You come straight back to this question after signing up.
Next: level type 7, gap levels. On ChartThread’s levels page every level starts at the candle that formed it, so on a new contract the first lines you see are the listing day’s.
Terms in this lesson
Related lessons
- How to find key levels: the candle that forms a level
- Level type 5: historical levels
- Level type 7: gap levels
- Level type 11: first-hour levels
- How a broken level gets reconfirmed coming soon
Educational content, not financial advice. Trading carries a risk of loss.