Round numbers: when $100,000 is a level
Everyone notices 100,000. But a round number is a level on its own only at an all-time high or low. Everywhere else it is a sign that makes a real level stronger.
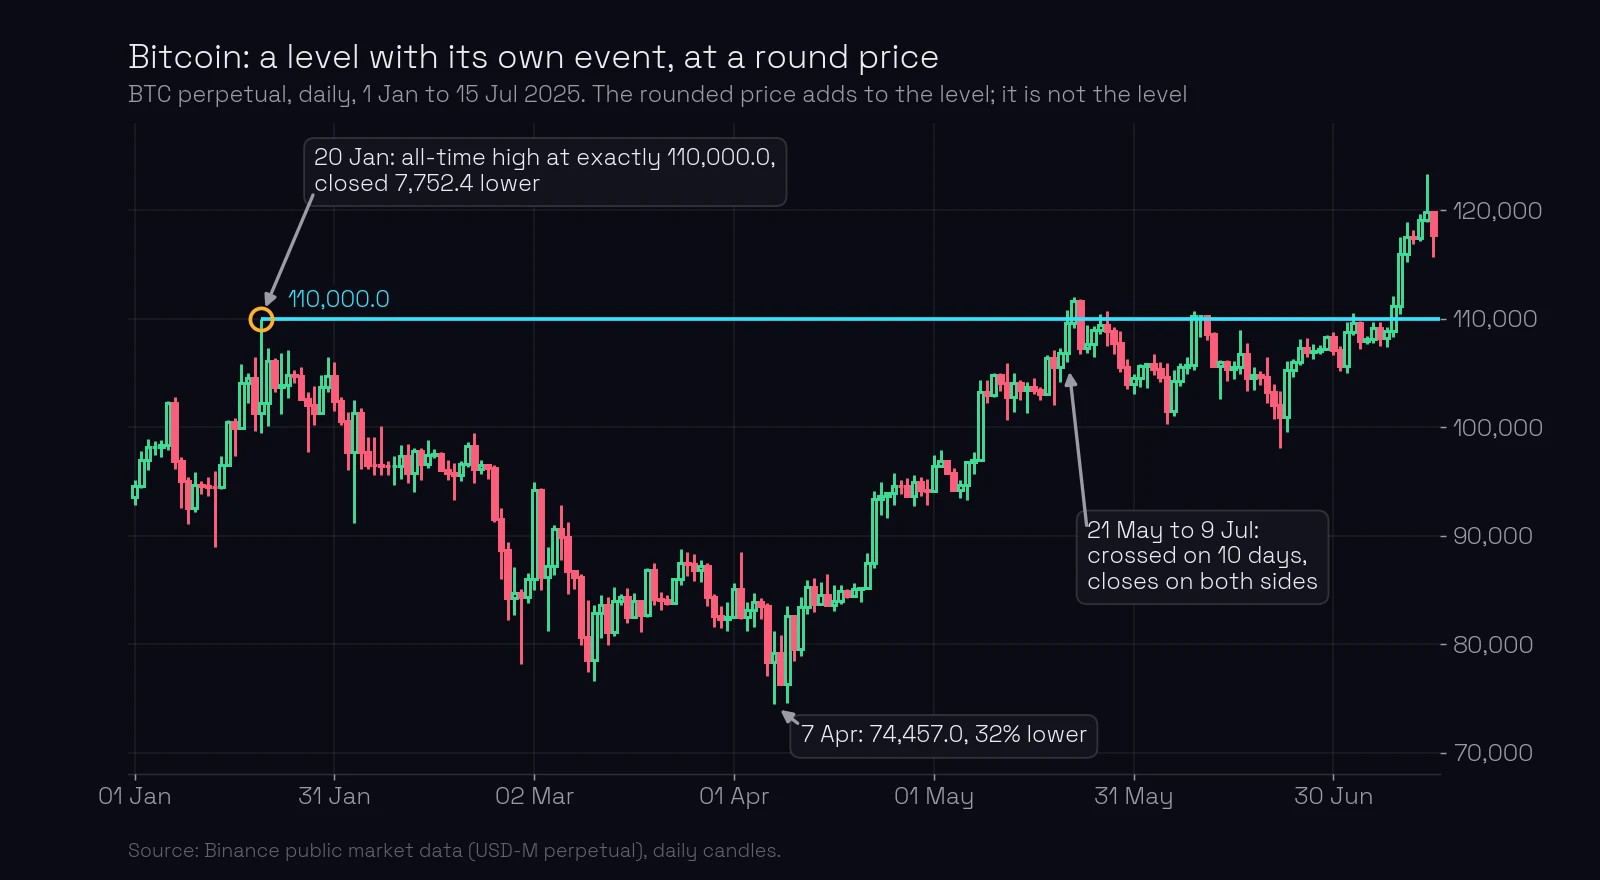
On 20 January 2025 Bitcoin’s contract set an all-time high at exactly 110,000.0. The level is there because of what happened that day. The round price only adds to it.
What you’ll learn
- When a round number is a level by itself, and when it only strengthens one.
- What real data says about highs and lows on round prices.
- How to check a level at a round number, step by step.
- Why a round level can still break.
When is a round number a level by itself?
Only at an all-time high or an all-time low. There, price is somewhere it has never been: there is no history to the left and no other level to draw from, so a round price such as 100,000 is the number every trader is watching.
Everywhere else, a round number with no event behind it is not a level, for two reasons:
- There are other levels nearby. Below an all-time high the chart has a history, and the real levels are the prices where something happened. A round number between them is just a number.
- A round number is often where a false breakout ends. All moves end in a false breakout, and a push often runs out at an obvious round price. But the level is not the false breakout: the level is the price the breakout failed at (the candle that forms a level).
A sign that strengthens a level
Every level needs an event and a candle that formed it: a repeated low or high, a big move that stopped or started, a false breakout (the candle that forms a level). Then come the signs that make the level stronger. Long tails, exact touches to the cent, consolidation at the level and others (the full checklist). One of them is simple: the price is rounded.
So the order is always the same. First the event, then the signs. Bitcoin’s 110,000.0 is a level because the all-time high of 20 January was there, and price fell 32% from it in eleven weeks. That the high was exactly 110,000.0 is a sign on top.
A round number with no event behind it is just a number. Look at Bitcoin’s 100,000 itself. Between December 2024 and November 2025, nine daily highs or lows came within 250 dollars of it, from 99,862.8 to 100,238.4. Not one was exactly 100,000. The round number drew price near; the levels were where the candles actually turned.
Do highs and lows really land on round prices?
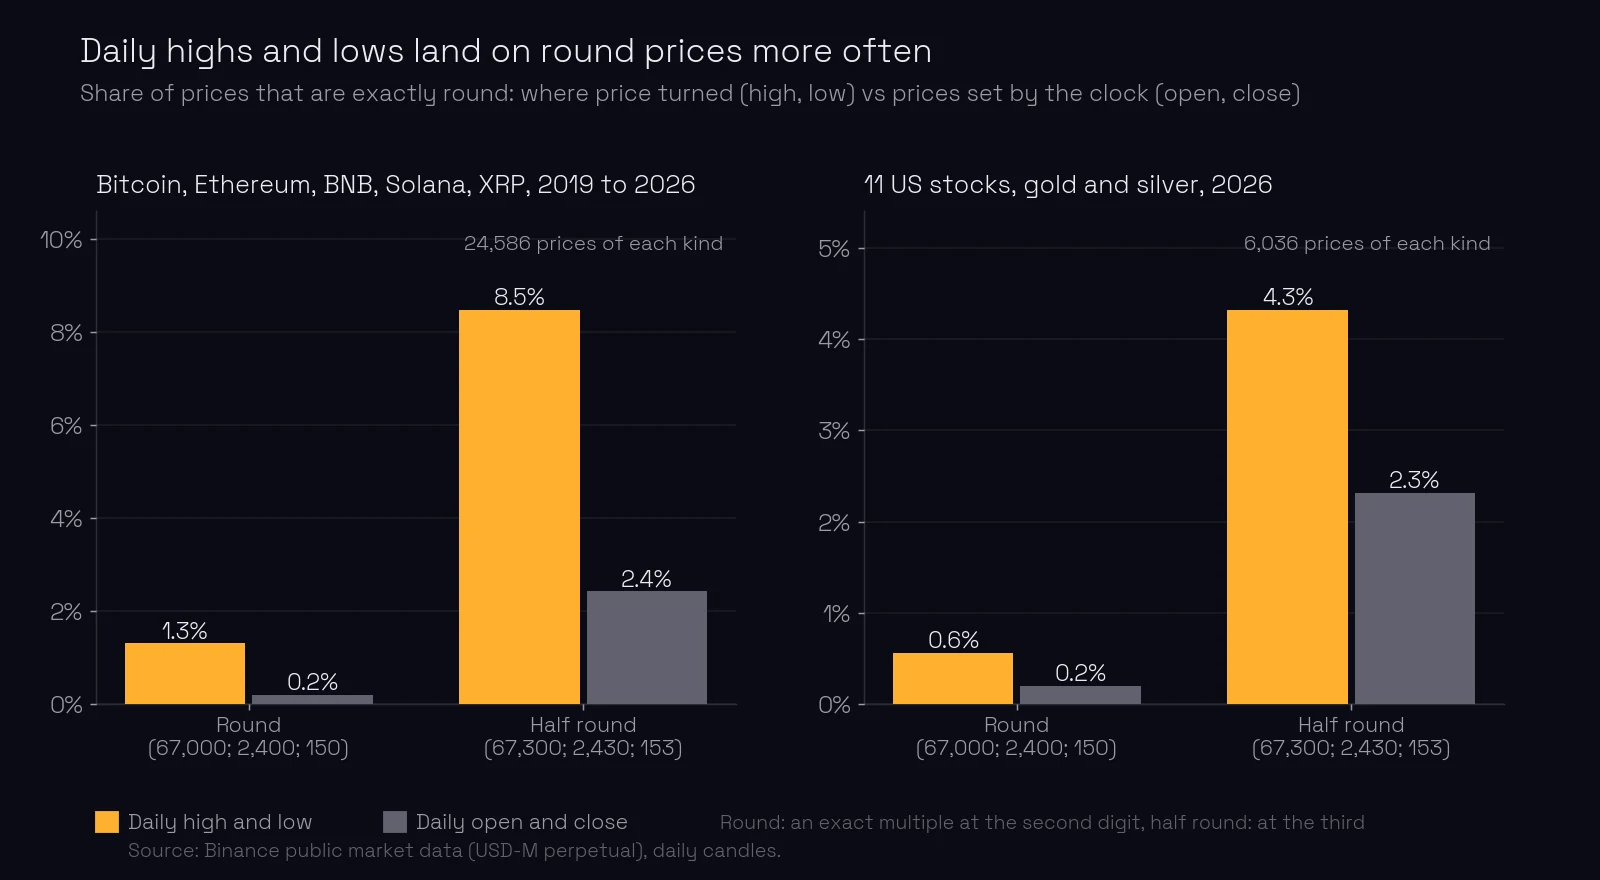
We tested it. If round prices mean nothing, a daily high or low should be exactly round as rarely as any other price. A fair comparison is the daily open and close, which are set by the clock (midnight UTC), not by anyone’s decision to turn the market.
The method:
- Daily candles of the Binance perpetual contracts for Bitcoin, Ethereum, BNB, Solana and XRP, from their listing (2019 to 2020) to 24 October 2026: 24,586 highs and lows, and as many opens and closes. Separately, 11 US stocks (NVIDIA, Tesla, Apple, Meta, Alphabet, Amazon, Microsoft, Palantir, SpaceX, Intel, AMD), gold and silver, from their listing (December 2025 to May 2026): 6,036 of each.
- Round means the price is exact at the second digit: 67,000 on Bitcoin, 2,400 on Ethereum, 150 on Solana, 1.30 on XRP. Half round means exact at the third digit: 67,300, 2,430, 153, 1.33.
- For every day, check the high and the low against the open and the close of the same day, so the tick size and price level are the same for both.
The results:
- Crypto majors, round: 322 highs and lows (1.3%) against 50 opens and closes (0.2%), about 6 times as often.
- Crypto majors, half round: 2,084 (8.5%) against 597 (2.4%), 3.5 times as often.
- Stocks, gold and silver, half round: 261 (4.3%) against 140 (2.3%), about 1.9 times. Round: 34 against 12, too few to read much into. Silver alone showed no difference.
The effect is real and it is small. Turns happen at round prices more often than chance, which fits the idea that many traders put their orders there. But 91.5% of the crypto highs and lows were not even half round. Most levels are not round numbers, and most round numbers are not levels.
Example: Bitcoin’s 110,000 on 21 May 2025
Walk through the level as you would have on 21 May 2025, with price coming back to it for the first time in four months.
- The event. 20 January 2025: high 110,000.0, close 102,247.6, 7,752.4 lower. A new all-time high, followed by a fall to 74,457.0 by 7 April. A big move started here.
- The forming candle and the price. The candle of 20 January; the level is its high, 110,000.0.
- The signs. The price is rounded. It is also an old extreme, and extremes are rarely broken on the first attempt (historical levels).
- The stop. The daily average true range (ATR) on 21 May was 3,092.1. The course places the stop-loss 10% of the daily ATR beyond the level:
- What happened. On 21 May price went to 110,830.0, 830.0 above the level, and closed back below at 109,609.5: a false breakout, but deep enough to take the stop. On 22 May price closed above, at 111,662.7. From 21 May to 9 July it crossed 110,000 on 10 days, with closes on both sides: a sawed-through level. On 14 July it reached 123,300.0.
The level was drawn correctly and it had a strengthening sign. It still broke. Signs raise the odds; the situation decides (no level is strong on its own).
What most traders miss. A round number is the one price every trader can see without drawing anything, so it feels safe. But being seen is not the same as being defended. The defence comes from the event that formed the level: someone who bought or sold at that exact price. Start from the candle, and let the round price be a reason to trust a level a little more, never a reason to invent one.
Common mistakes
- Drawing a level at every round number. Fix: first find the event and its candle; a round price with no event is not a level, unless price is at an all-time high or low.
- Moving a level to the nearest round number. Fix: the level is the exact high or low of the forming candle, 109,980.0 stays 109,980.0.
- Treating a round level as unbreakable. Fix: a rounded price is one sign; check the situation as for any level.
- Setting the stop at a round number. Fix: the stop is 10% of the daily ATR beyond the level.
Key takeaways
- A rounded price is a sign that strengthens a level, not a level by itself, except at an all-time high or low.
- On 24,586 daily highs and lows of crypto majors, 8.5% were half round against 2.4% of opens and closes.
- The effect is smaller on stocks and gold (4.3% against 2.3%) and absent on silver.
- Most levels are not round, and most round numbers are not levels.
- Bitcoin’s 110,000.0 was an all-time high at a round price, and it was still sawed through in mid-2025.
Lesson test · 8 questions
Check yourself
Can you pass on the first try?
Passing the test completes this lesson. Tests in a module open in order, each after the one before it. A first-try pass scores 100%. Each wrong answer costs 10 points, and every 10 wrong answers lock the test for 30 minutes. Once you pass, your score is final, except that a score of 50 or less can be retaken once.
Tests in a module open in order. Pass the test of the previous lesson first: Touches to the cent: why precision matters. You can still read the questions here.
-
In this course, what is a round price?
-
Price is near 80.00, well below its all-time high, and nothing ever happened at 80.00 on the chart. What do you have?
-
On five crypto majors, how often were daily highs and lows exactly half round (like 67,300), compared with daily opens and closes?
-
Why were daily opens and closes used as the comparison?
-
A big fall stopped at a low of 1,987.40. Where is the level?
-
Bitcoin’s 110,000.0 was an all-time high at a round price. What happened when price came back in May 2025?
-
Price comes back to a level at 110,000.0 and you plan a short. On that day the daily ATR is 3,092.1. Where does the stop of a short go?
-
When does the course count a round number as a level by itself?
Free account
Take the test and keep your score
- Your answers are checked and every lesson you pass is marked complete.
- Your scores build into your course score, on any device.
- You come straight back to this question after signing up.
Next: deep false breakouts weaken a level coming soon. Open Bitcoin on ChartThread’s levels page and check, for each round number near price, whether a real event stands behind it.
Terms in this lesson
Related lessons
- What makes a level strong? The full checklist
- Touches to the cent: why precision matters
- Level type 5: historical levels
- Strongest support and resistance: the situation decides
- Sawed-through levels: when a level is used up coming soon
Educational content, not financial advice. Trading carries a risk of loss.