Level type 10: retracement levels
A big move does not run in a straight line. It runs, pulls back, and runs on. The extreme of that pullback is the tenth level type: the retracement level.
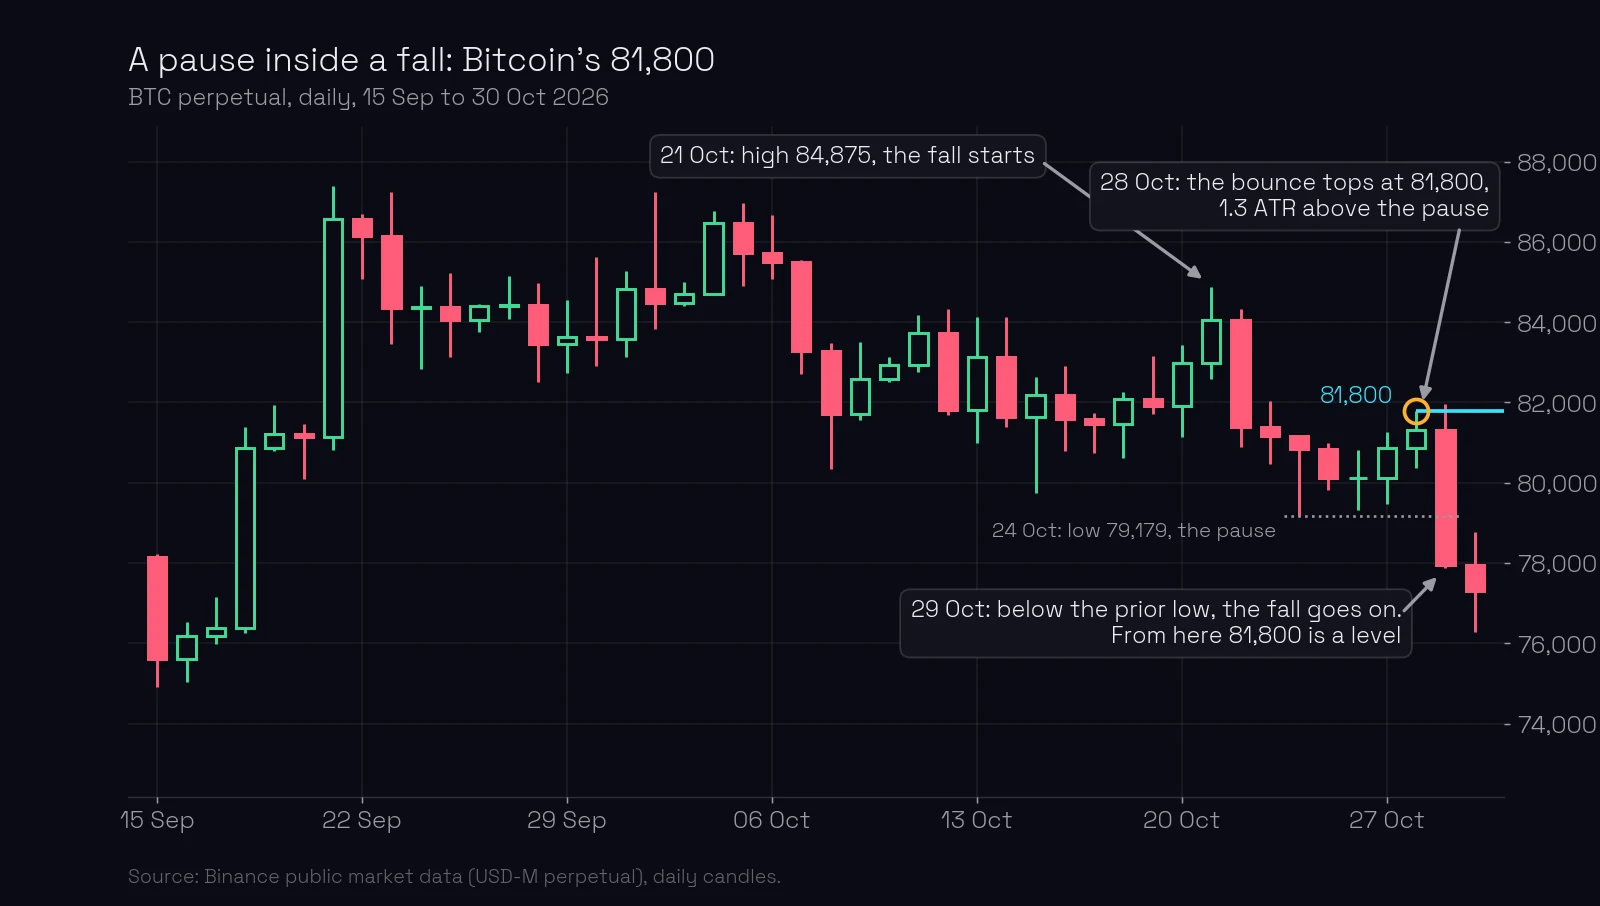
On 28 October 2026 Bitcoin’s perpetual contract bounced to 81,800 inside a fall. The next day the fall went on and made a lower low. From that moment 81,800 is a level.
What you’ll learn
- Which side of a pullback is the level in a fall and in a rise.
- The one condition that turns a pause into a level: the move has to go on.
- Why the strongest moves start and end with false breakouts.
- How ChartThread measures a retracement, in daily ATR.
What is a retracement level?
A trend is a chain of runs and pauses. During a pause price moves against the trend for a few days, then the trend takes over again. That pause is a pullback, or retracement; the two words mean the same thing.
The rule for this type is simple:
- In a downtrend, the upper side of the retracement is the level: the highest high of the bounce.
- In an uptrend, the lower side of the retracement is the level: the lowest low of the dip.
As always in this course the level is one exact price, the high or the low of a candle (the candle that forms a level), never the middle of the pause and never a close.
Why the top of a bounce is a level
Think about who was at that price. The fall paused; buyers tried to take it back; at one price sellers stepped in again and the fall resumed. The high of the bounce is where the seller who runs the move showed that they were still there. The same player who started the move defended it at that price.
That is why the level is drawn at the extreme of the pullback and not somewhere inside it. The extreme is the one price where the other side was refused.
When a pause becomes a level
A pause by itself is not yet a level. For a retracement to count, the move has to go on past the point where it paused: in an uptrend the high must be updated, in a downtrend the low must be updated. Until then the bounce may turn out to be the start of a real reversal, and then its high belongs to a different type, the trend-change level.
On the Bitcoin chart the fall from 84,875.20 on 21 October paused at 79,178.60 on 24 October. The bounce ran three days and topped at 81,800 on 28 October. On 29 October price traded down to 77,868.40, below the prior low, and closed at 77,962.60. The low was updated, so 81,800 became a retracement level that day. On 30 October the fall reached 76,270, 2,908 below the prior low, about 1.5 daily ATR.
The strongest moves start and end with false breakouts
A big move usually begins when price fakes the other way first: a push below an old low that fails, and then the real move up. It usually ends the same way, with a false breakout past the last extreme that fails to hold. So the two ends of a move are the level types you already know: the false breakout that started it (false-breakout levels) and the trend change that ended it (trend-change levels). The retracement level is what the move leaves in the middle.
How ChartThread measures it
ChartThread draws retracement levels on every daily chart with three checks, all measured in the instrument’s daily ATR:
- The pause must be shallow: a counter-move of less than 2 ATR. Deeper than that, the walk sees a reversal, and the price is a trend-change level instead.
- There must be a move to retrace: the run from the last turn has to span at least 3 ATR. Inside a sideways range every rotation “updates” the previous one days later, and those pauses are not retracements of anything.
- The move must really go on: after the pause, price has to extend at least 1 ATR beyond the extreme it retraced from. A poke a few ticks past an old low is a retest, not a resumed trend.
One more rule: one level per leg, its deepest pause. Shallower pauses inside the same leg are part of the same story.
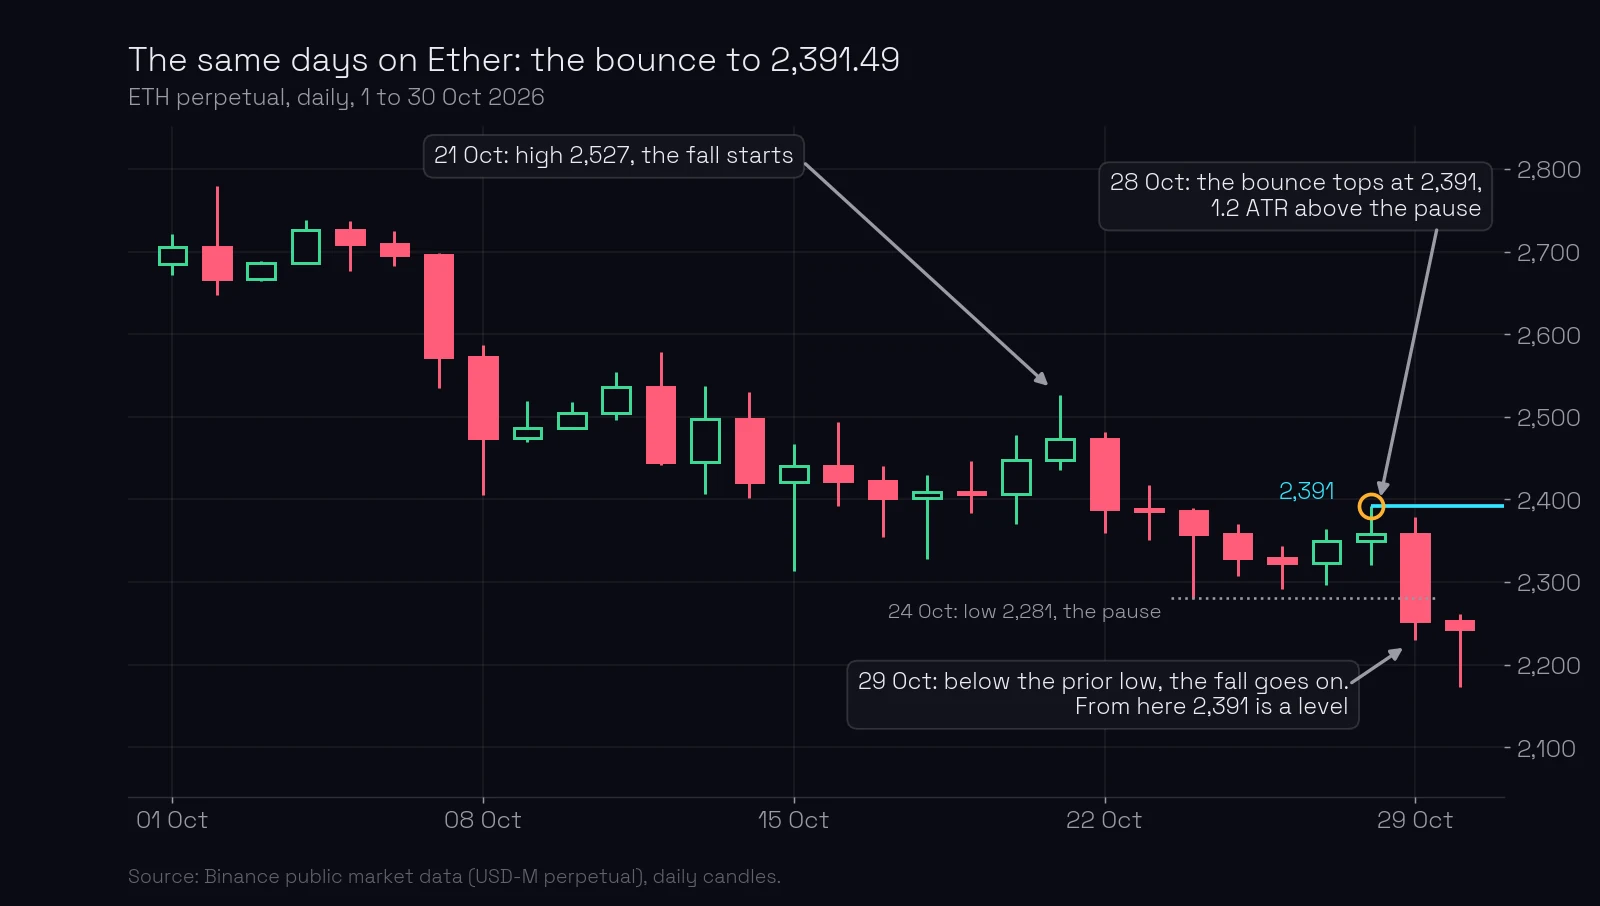
Ether did the same thing on the same days. The fall from 2,526.99 on 21 October paused at 2,281.22 on 24 October, bounced to 2,391.49 on 28 October, and on 29 October traded to 2,230.20, below the prior low. On 30 October the low was 2,172.85, 108 below the retraced extreme, about 1.2 daily ATR. The retracement level is 2,391.49.
Example: Bitcoin’s 81,800, step by step
- The move. From the high of 84,875.20 on 21 October to the low of 79,178.60 on 24 October: 5,697 points in four days. The daily ATR on 24 October was about 2,090, so the leg was about 2.7 ATR. Big enough to retrace.
- The pause. Three days of bounce, 25 to 28 October. The highest high of the bounce was 81,800 on 28 October.
- The depth. 81,800 − 79,178.60 = 2,621.40. With a daily ATR of about 1,990 on 28 October that is 1.3 ATR: shallow, well under 2.
- The update. On 29 October the low of the day was 77,868.40, 1,310 below the prior low. The fall resumed. From this candle on, 81,800 is a level.
- The extension. On 30 October price reached 76,270, 2,908 below the retraced low, about 1.5 ATR. The move went on properly; this was not a retest.
- Where it is now. Price closed on 30 October at 77,312.60, 4,487 below the level. The level is drawn from 28 October to the right and waits.
You can see this level on Bitcoin’s chart on ChartThread.
What most traders miss. They draw the level the day the bounce turns, and half of those lines are not retracements but the start of a reversal. The condition is the update: the move has to go on and make a new extreme first. A retracement level is confirmed by what happens after it, which is why it is drawn a few days late and why it is reliable.
Common mistakes
- Drawing the level at the middle of the pause. Fix: the level is the extreme of the pullback, the high in a fall, the low in a rise.
- Calling every pause a retracement. Fix: no update, no level. If price never makes a new low after the bounce, the bounce was something else.
- Retracing a move that is not there. Fix: inside a sideways range there is no trend to retrace; those turns are trend-change or limit levels, if anything.
- Taking a one-tick poke as the update. Fix: ChartThread asks for at least 1 ATR beyond the old extreme.
Key takeaways
- A retracement level is the extreme of a pullback: the high of a bounce in a fall, the low of a dip in a rise.
- It counts only after the move goes on and updates the low or the high.
- The strongest moves start and end with false breakouts; the pause in the middle leaves a level.
- ChartThread’s checks: pause under 2 ATR, leg of at least 3 ATR, extension of at least 1 ATR, one level per leg.
Lesson test · 7 questions
Check yourself
Can you pass on the first try?
Passing the test completes this lesson. Tests in a module open in order, each after the one before it. A first-try pass scores 100%. Each wrong answer costs 10 points, and every 10 wrong answers lock the test for 30 minutes. Once you pass, your score is final, except that a score of 50 or less can be retaken once.
Tests in a module open in order. Pass the test of the previous lesson first: Level type 9: consolidation levels. You can still read the questions here.
-
In a downtrend, which price of a pullback is the retracement level?
-
In an uptrend, which price of a pullback is the retracement level?
-
When does the extreme of a pause start to count as a retracement level?
-
Bitcoin fell from 84,875.20 to 79,178.60, bounced to 81,800 on 28 October 2026, and on 29 October traded down to 77,868.40. Where is the retracement level?
-
A fall pauses and bounces; then price rises for two weeks without ever making a new low. What was the top of the bounce?
-
The daily ATR is 2.00. A fall pauses and bounces 5.50 before going on. How does ChartThread read the bounce?
-
How do the strongest moves usually start and end, according to this lesson?
Free account
Take the test and keep your score
- Your answers are checked and every lesson you pass is marked complete.
- Your scores build into your course score, on any device.
- You come straight back to this question after signing up.
Next: where a big move stopped coming soon. On ChartThread’s levels page retracement levels appear the day the move goes on past the pause.
Terms in this lesson
Related lessons
- Where a big move stopped: the level behind it coming soon
- Level type 2: false-breakout levels
- Consolidation at the level: price resting on the line coming soon
- What makes a level strong? The full checklist
Educational content, not financial advice. Trading carries a risk of loss.