Level type 11: first-hour levels
A stock market opens at a fixed time. In the first hour the orders that piled up overnight meet, the volume is the heaviest of the day, and price finds a range.
The high and the low of that hour are the eleventh level type: the first-hour level.
What you’ll learn
- Why the first hour of a session makes levels, and which two prices they are.
- Where the first hour is on a stock perpetual on Binance or Bybit, in UTC.
- How Nvidia’s first-hour levels held one day, broke another and were tested to the cent a third.
- Why these levels do not exist on Bitcoin.
What is a first-hour level?
The rule has four parts:
- It works on markets that do not trade 24/7. A stock exchange is closed overnight and at weekends. When it opens, everything that happened while it was closed is priced in the first minutes, by everyone at once.
- On Binance and Bybit it applies to perpetual contracts on stocks. The contract itself trades around the clock, but the stock behind it does not, and the contract follows the stock. The first hour is the first hour of the underlying stock market’s session.
- The high and the low of the first hour are strong levels. Draw them at the end of the hour and keep them for the day.
- The first hour usually has a lot of volume. That is what makes its range matter: the most trading of the day happened between those two prices.
For a stock listed in New York the session opens at 09:30 local time. In UTC that is 13:30 while New York is on daylight time, from March to the first Sunday of November, and 14:30 for the rest of the year. So the first hour is 13:30 to 14:30 UTC in summer and 14:30 to 15:30 UTC in winter. Weekends and the exchange’s public holidays have no first hour: ignore them, and ignore the candles the perpetual prints while the stock market is closed.
This is a level inside the day, read on a 5-minute chart, not on the daily chart. It does not replace the daily levels from the daily chart; it works next to them, for the hours of that session.
Nvidia, three sessions in October 2026
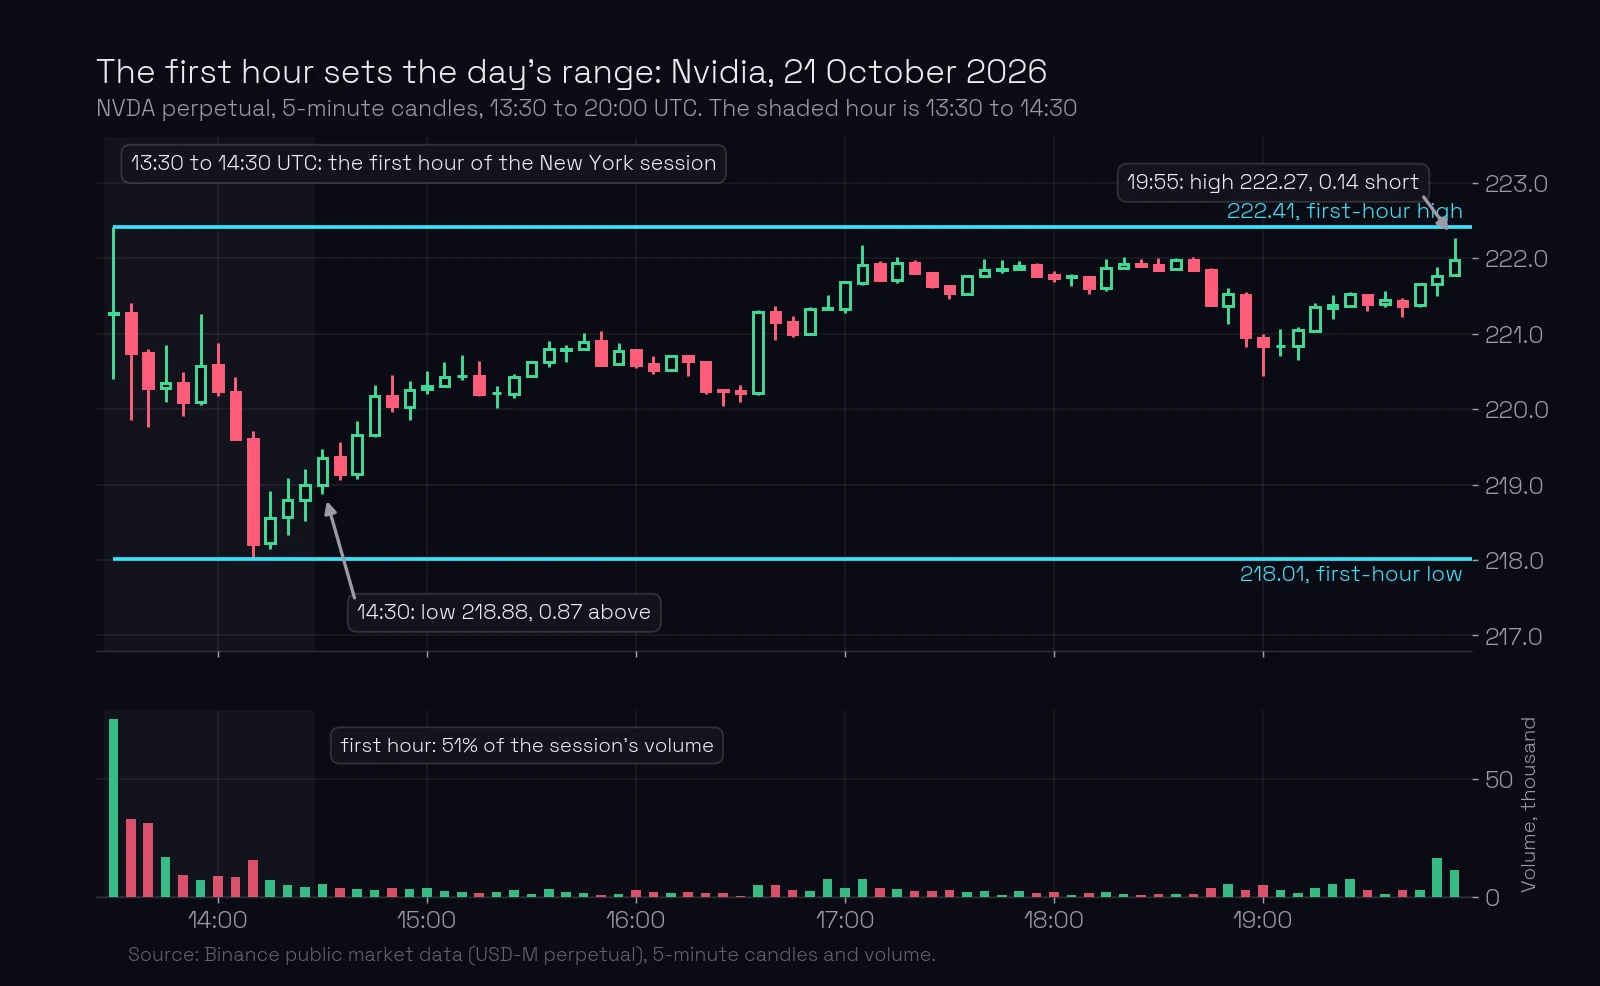
The charts show the Nvidia perpetual on Binance in 5-minute candles. New York was on daylight time, so the first hour is 13:30 to 14:30 UTC.
21 October: the day stays inside. The first hour printed a high of 222.41 and a low of 218.01. For the next five and a half hours price never left that range: the highest point of the rest of the session was 222.27, 0.14 short of the first-hour high, and the lowest was 218.88, 0.87 above the first-hour low. The first hour carried 51% of the session’s volume. The daily candle’s low that day was 218.01, the first-hour low itself.
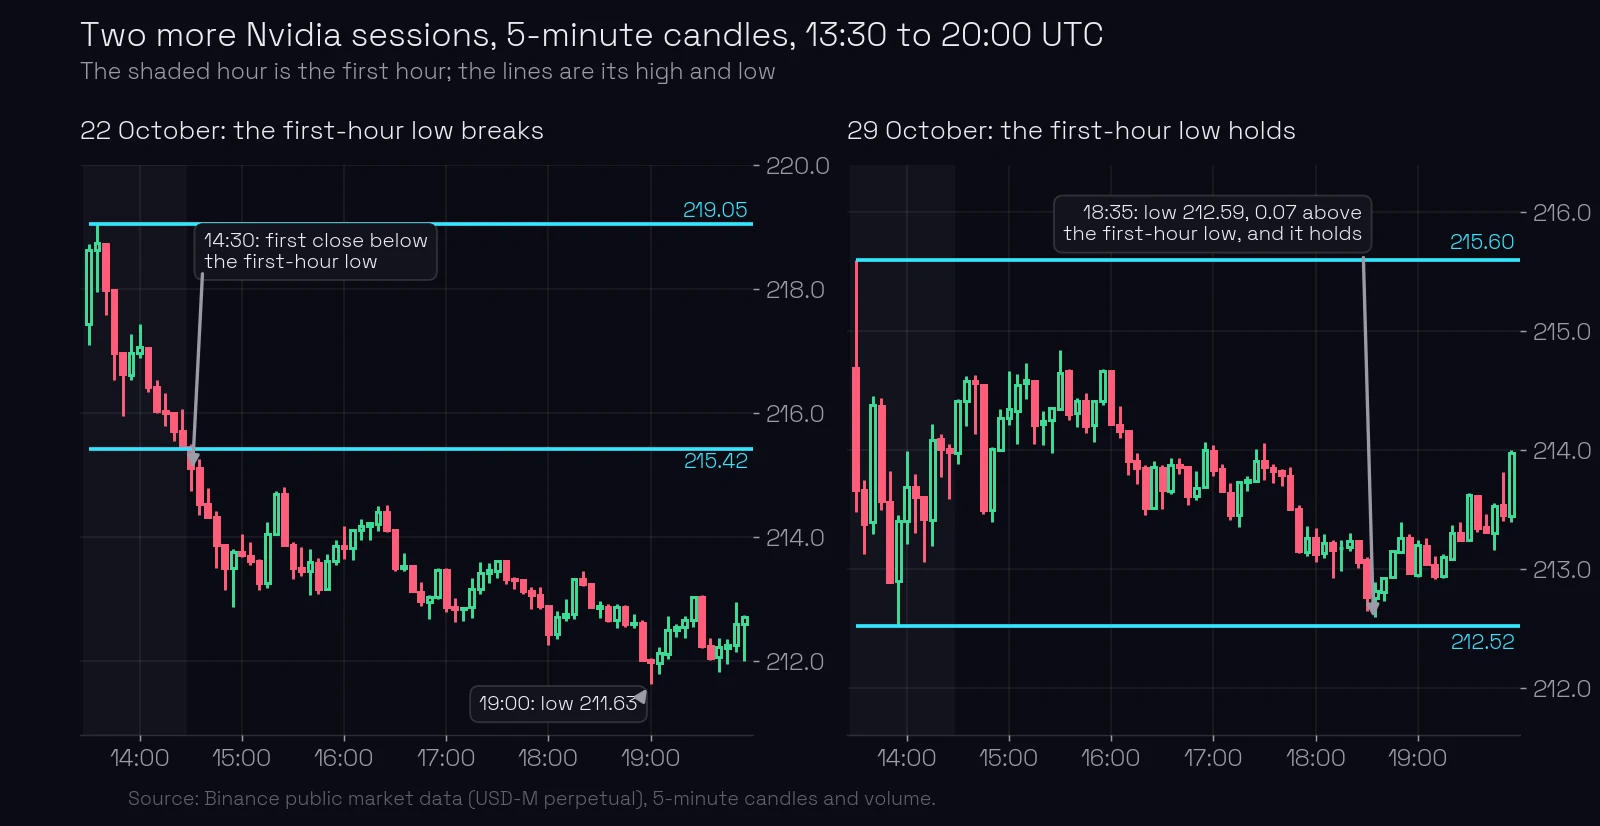
22 October: the low breaks. First hour 219.05 to 215.42. The very first candle after the hour, 14:30 UTC, closed below 215.42, and from there price fell to 211.63 by 19:00: 3.79 below the level, 0.65 of that day’s daily average true range of 5.86. A first-hour level that breaks on a close is not a wall any more; it is the place the move started from.
29 October: the low holds to the cent. First hour 215.60 to 212.52. At 18:35 UTC price came down to 212.59, 7 cents above the first-hour low, and turned. A touch that close is the kind of precision that makes a level trustworthy. The daily ATR was 5.46, so one stop below the level was 0.55, and the test came nowhere near it.
Three sessions, three behaviours: inside, break, hold. In each case the first hour gave the two prices the rest of the day was about.
Why the volume matters
Across the ten Nvidia sessions from 19 to 30 October 2026 the first hour carried between 18% and 52% of the session’s volume, and on six of the ten days it was the heaviest hour. A range where that much business was done is a range the market remembers for the rest of the day. The big player who filled orders in that hour has a position with an average price inside it.
How to use a first-hour level
- Find the session. For a New York stock: 13:30 UTC in summer, 14:30 UTC in winter. Skip weekends and holidays.
- Wait for the hour to close. The levels exist only at 14:30 (or 15:30). Nothing is drawn before.
- Take the exact high and low of the twelve 5-minute candles and draw them to the right, for that session.
- Read the rest of the session against them. A test that holds, like 29 October, is a place to trade from. A close through, like 22 October, breaks the level.
- Size the stop from the daily ATR, as always: 10% of it. On Nvidia that was 0.55 to 0.59 in those sessions.
- Next morning, start again. A first-hour level is for its own session. The daily levels stay.
Open Nvidia on ChartThread and switch to 5-minute candles to see the first hour of any session.
What most traders miss. Bitcoin has no first hour. It trades every minute of every day, so there is no bell, no overnight queue of orders and no hour that stands out. The first-hour level belongs to instruments with a closed market behind them: stock perpetuals, and the gap levels that come from the same closed hours.
Common mistakes
- Using the UTC midnight candle as the open. Fix: the session opens when the stock market opens, 13:30 or 14:30 UTC for New York, not at 00:00.
- Drawing the levels before the hour is over. Fix: the high and low are known only at the end of the first hour.
- Counting the overnight candles of the perpetual. Fix: ignore the hours the stock market is closed, and ignore weekends and holidays.
- Keeping yesterday’s first-hour levels today. Fix: each session has its own. The levels that last are the daily ones.
Key takeaways
- On markets with an opening bell, the high and the low of the first hour are strong levels for that session.
- On Binance and Bybit this applies to perpetual contracts on stocks; the first hour is the underlying market’s first hour, in UTC.
- Nvidia’s first hour on 21 October 2026 contained the whole session; on 22 October the low broke; on 29 October it held by 7 cents.
- The first hour usually carries the most volume of the day, which is why its range matters.
- Bitcoin and other 24/7 instruments have no first-hour levels.
Lesson test · 7 questions
Check yourself
Can you pass on the first try?
Passing the test completes this lesson. Tests in a module open in order, each after the one before it. A first-try pass scores 100%. Each wrong answer costs 10 points, and every 10 wrong answers lock the test for 30 minutes. Once you pass, your score is final, except that a score of 50 or less can be retaken once.
Tests in a module open in order. Pass the test of the previous lesson first: Level type 10: retracement levels. You can still read the questions here.
-
Which prices are the first-hour levels?
-
On Binance and Bybit, which instruments have first-hour levels?
-
New York is on daylight time. When is the first hour of the session in UTC?
-
Nvidia’s first hour on 21 October 2026 printed 222.41 and 218.01. The rest of the session reached 222.27 and 218.88. How does the course read it?
-
On 22 October 2026 a 5-minute Nvidia candle closed below the first-hour low of 215.42, and price fell to 211.63. What is the state of that level?
-
Why does the first hour’s range matter more than any other hour’s?
-
The daily ATR of a stock perpetual is 5.46. Where does the course size a stop below a first-hour low?
Free account
Take the test and keep your score
- Your answers are checked and every lesson you pass is marked complete.
- Your scores build into your course score, on any device.
- You come straight back to this question after signing up.
Next: long tails, why the longest wick makes the strongest level. On ChartThread’s levels page the 5-minute chart shows the first hour of any stock perpetual’s session.
Terms in this lesson
Related lessons
- Best timeframe for support and resistance: the daily chart
- Level type 6: IPO and listing levels
- Level type 7: gap levels
- Where a big move stopped: the level behind it coming soon
- Near misses: candles that almost touch the level coming soon
Educational content, not financial advice. Trading carries a risk of loss.