Level type 9: consolidation levels
A fund cannot buy a big position at one price. It buys for weeks, inside a range, and it knows its average.
The middle of that range is a level: the consolidation level.
What you’ll learn
- Why a consolidation is where big players build positions, and why its average price is a level.
- How to find the box and its average on a daily chart.
- The one condition that confirms the level and shows the direction.
- What Ethereum did in the summer of 2026.
Why an average price is a level
Big players, funds and hedge funds work with an average price. They cannot buy a position worth hundreds of millions at a single price: the first order would move the market against them. So they define a range and buy inside it, day after day, at prices around an average they are happy with.
While they do that, the chart shows a trading range: weeks of candles going nowhere. That is accumulation if they are buying and distribution if they are selling. Either way, the average price of the range is where the position was built, and the players who built it will defend it. That average is the consolidation level.
The more accumulation there was, the more power the instrument has to go further afterwards. A five-week box is a bigger position than a five-day one.
How to find the level
- Find the box. On the daily chart, the first day price stops trending and the last day before it leaves. Take the highest high and the lowest low inside it.
- Take the middle. Add the highest high and the lowest low and divide by two. That is the average price the players work around, and the line to draw.
- Wait for the condition. A candle that opens and closes on one side of the average without penetrating it confirms the level, and the side it closed on is the direction.
The third step is the whole point. Inside the box, candles cross the average all the time; it is the price the players work around, not a line they respect every day. The day a candle sits entirely on one side of it and does not touch it, the building is done and the direction is shown.
Example: Ethereum, 14 July to 18 August 2026
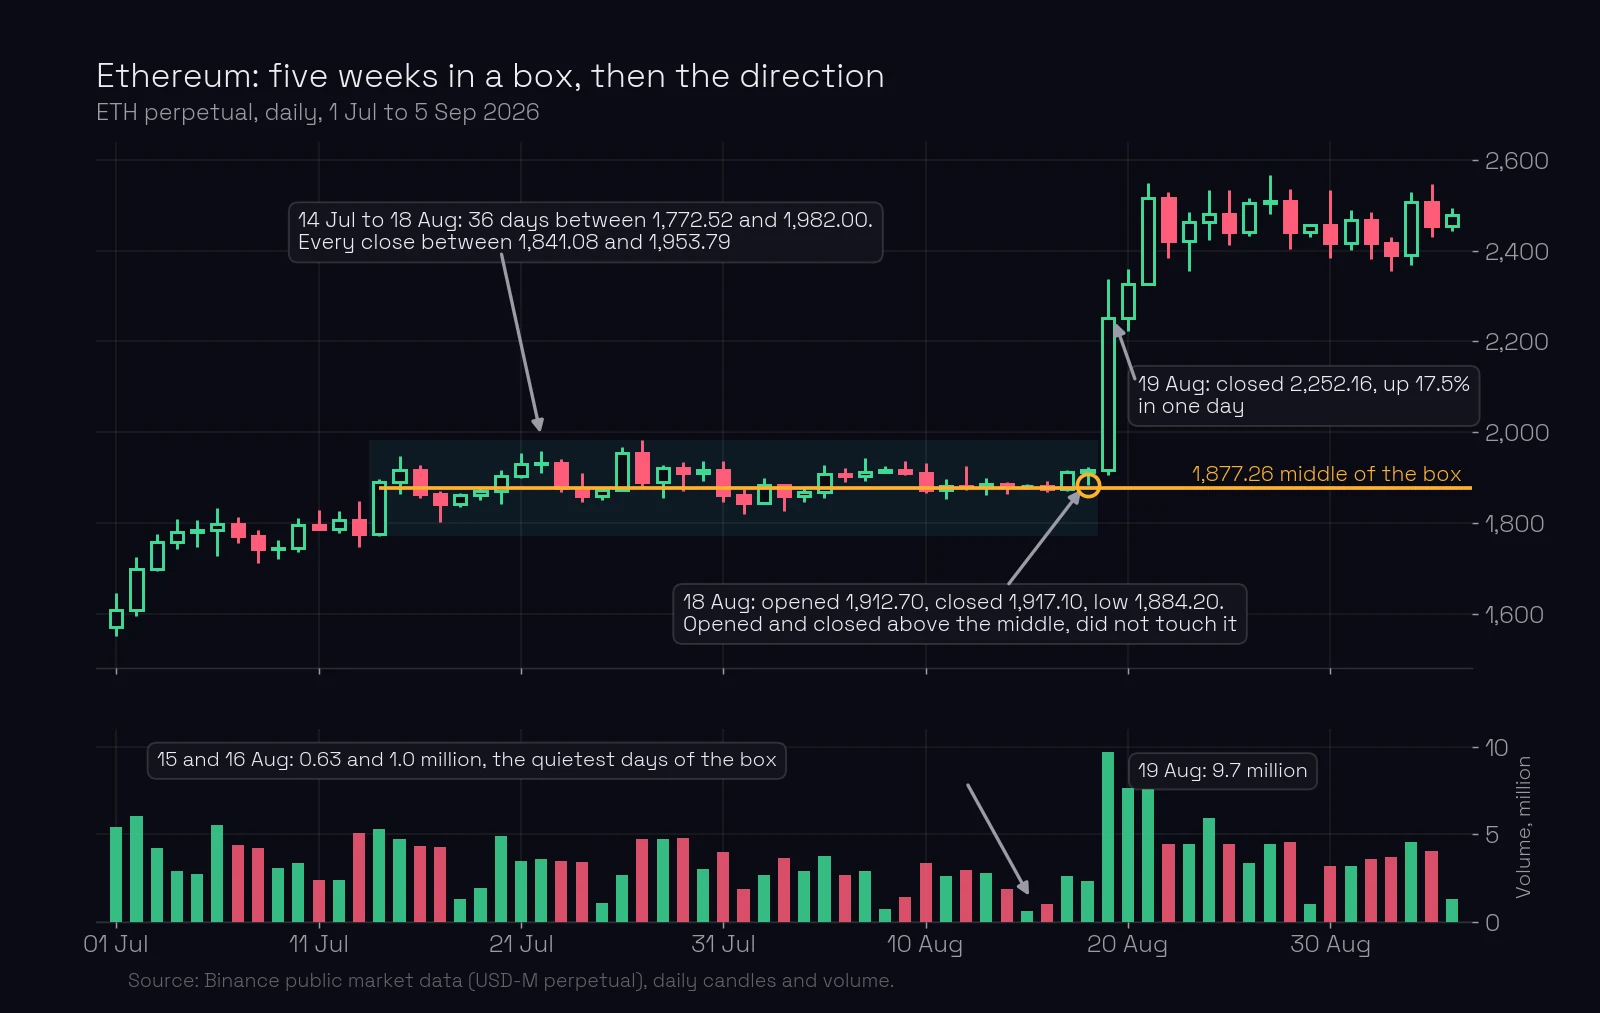
From 14 July to 18 August the Ethereum contract traded in a box for 36 days: highest high 1,982.00 on 27 July, lowest low 1,772.52 on 14 July, and every daily close between 1,841.08 and 1,953.79.
- The middle. (1,982.00 + 1,772.52) / 2 = 1,877.26. That is the level.
- Inside the box. Of the 36 candles, 17 opened and closed above the middle, 6 below, and 13 crossed it. The level was not respected day by day. It was the price the position was built around.
- The condition. On 18 August the candle opened at 1,912.70 and closed at 1,917.10. Its low was 1,884.20, 6.94 above the middle: the candle opened and closed above the level and did not even touch it with its wick. The direction was up.
- The direction. On 19 August the contract closed at 2,252.16, up 17.5% in one day, on 9.7 million contracts against 0.63 and 1.0 million on 15 and 16 August, the quietest days of the box. On 21 August it closed at 2,515.97, 34% above the level.
The quiet days before the breakout are typical. By the end of the box the buyer has the position they wanted and nobody else is trading; the volume comes with the move.
Consolidation on top of a level
This type has a cousin among the signs that strengthen a level: when price consolidates on top of, above or in the middle of an existing level, that level gets stronger, because the position was built right at it. That is consolidation at the level coming soon. Here the consolidation makes the level; there it confirms one that already existed.
On ChartThread
ChartThread does not draw consolidation levels. The engine draws levels formed by a single candle’s high or low, and an average of closes is neither. Find the box on the levels page, take the average by hand, and watch for the candle that opens and closes on one side of it. The levels the engine does draw around the box, like the 1,982.00 high of 27 July, show you where the box ended.
What most traders miss. Five weeks of flat candles look like nothing is happening. Something is: a position is being built, at an average price someone will defend. The direction is not a guess. It is shown by the first candle that sits entirely on one side of that average.
Common mistakes
- Drawing the top and bottom of the box as the level. Fix: the top and bottom are levels of their own types; the consolidation level is the average price inside.
- Trading the average while price still crosses it daily. Fix: wait for a candle that opens and closes on one side of it without touching it.
- Reading quiet volume at the end of a box as weakness. Fix: the buyer is done; the volume comes with the move.
- Calling every flat week a consolidation. Fix: a position worth defending takes weeks on the daily chart, not days.
Key takeaways
- Big players build positions inside a range and work with an average price.
- That average is the consolidation level.
- Inside the box candles cross it; the level is confirmed by a candle that opens and closes on one side of it without penetrating it.
- The side of that candle is the direction.
- Ethereum: a 36-day box, middle 1,877.26, confirmed on 18 August, up 17.5% the next day.
Lesson test · 7 questions
Check yourself
Can you pass on the first try?
Passing the test completes this lesson. Tests in a module open in order, each after the one before it. A first-try pass scores 100%. Each wrong answer costs 10 points, and every 10 wrong answers lock the test for 30 minutes. Once you pass, your score is final, except that a score of 50 or less can be retaken once.
Tests in a module open in order. Pass the test of the previous lesson first: Level type 8: abnormal-candle levels. You can still read the questions here.
-
Why do big players build positions inside a range instead of at one price?
-
What is the consolidation level?
-
Inside a box of 36 days, 13 candles cross the middle, 17 sit above and 6 below. What does that say about the level?
-
Which candle confirms a consolidation level and shows the direction?
-
The middle of a box is 1,877.26. On 18 August Ethereum opened at 1,912.70, closed at 1,917.10 and its low was 1,884.20. Was the condition met?
-
A contract trades for five weeks between 118.40 and 131.60. Where is the consolidation level?
-
Volume on the last two quiet days of Ethereum’s box was 0.63 and 1.0 million, against 9.7 million on the breakout day. How does the course read the quiet days?
Free account
Take the test and keep your score
- Your answers are checked and every lesson you pass is marked complete.
- Your scores build into your course score, on any device.
- You come straight back to this question after signing up.
Next: level type 10, retracement levels. On ChartThread’s levels page you can see the box and the levels around it on any instrument.
Terms in this lesson
Related lessons
- Consolidation at the level: price resting on the line coming soon
- Level type 4: limit-player levels
- Level type 1: trend-change levels
- Where a big move stopped: the level behind it coming soon
Educational content, not financial advice. Trading carries a risk of loss.