Level type 5: historical levels
Some levels are years old and still work. Price leaves a price, trades far away for a long time, comes back, and stops at the same number.
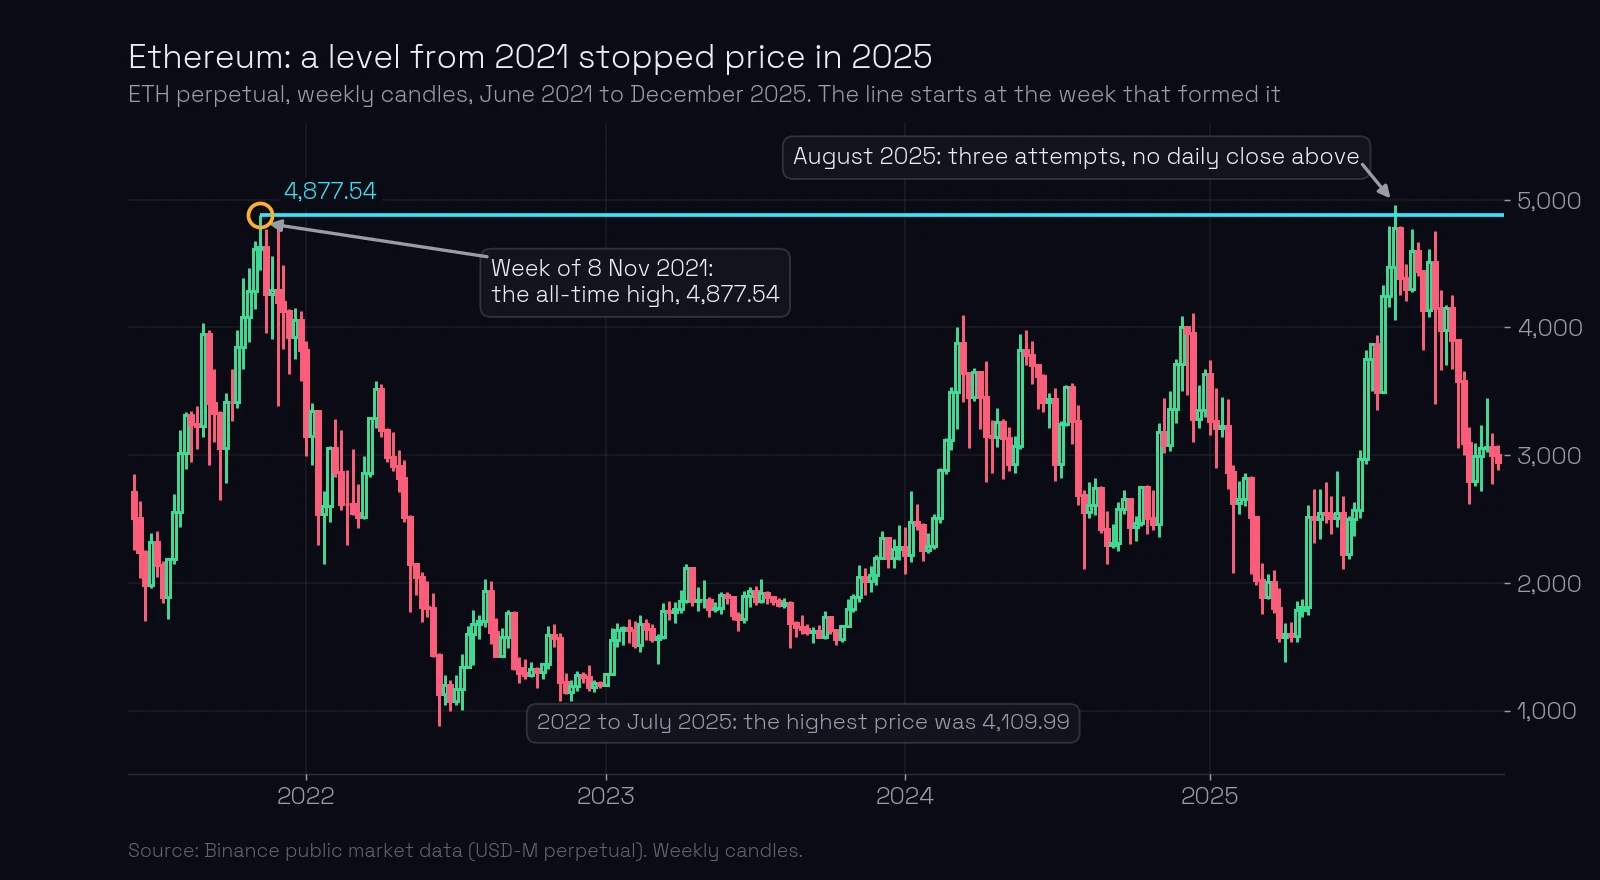
On 10 November 2021 Ethereum’s perpetual contract set an all-time high of 4,877.54. Price did not trade there again for almost four years. In August 2025 it came back, tried three times, and could not close a single day above it.
What you’ll learn
- What a historical level is, and which events make one.
- Why all-time highs and lows are levels that every trader sees.
- Why an extreme is rarely broken on the first attempt.
- How far back to look, and when to switch to the weekly or monthly chart.
What a historical level is
A historical level is a level price met before. It is not a new kind of event. It is one of the events you already know, seen from far away:
- a trend-change level, where a big move stopped and turned;
- a false-breakout level, where price went beyond a high or low and closed back;
- a limit-player level, where a big player held one price again and again.
Ethereum’s 4,877.54 is a trend-change level. After it, price fell to 878.04 by 18 June 2022, 82% lower. The forming candle is 10 November 2021, and the level is its high (the candle that forms a level).
What makes a historical level worth using is what happened after it formed. It is good if price did not saw through it: no breaks back and forth, no long tails on both sides, no closes above and below again and again. A sawed-through level is still drawn correctly, but nobody defends it any more (sawed-through levels coming soon).
Ethereum’s 2021 high is as clean as a level gets. From January 2022 to 8 August 2025 the highest price was 4,109.99, on 16 December 2024. Nobody traded at 4,877.54 for almost four years, so nothing could saw through it.
All-time highs and lows: the levels everyone sees
A historical level can be an all-time high or an all-time low. These are the most visible prices on any chart. Every player sees them, on every timeframe, without drawing anything: a fund on the monthly chart, a day trader zooming out, an algorithm that tracks the highest price ever paid.
And extremes are rarely broken on the first attempt. When price comes back to an old extreme for the first time, it often stops short of it or goes a little beyond and closes back.
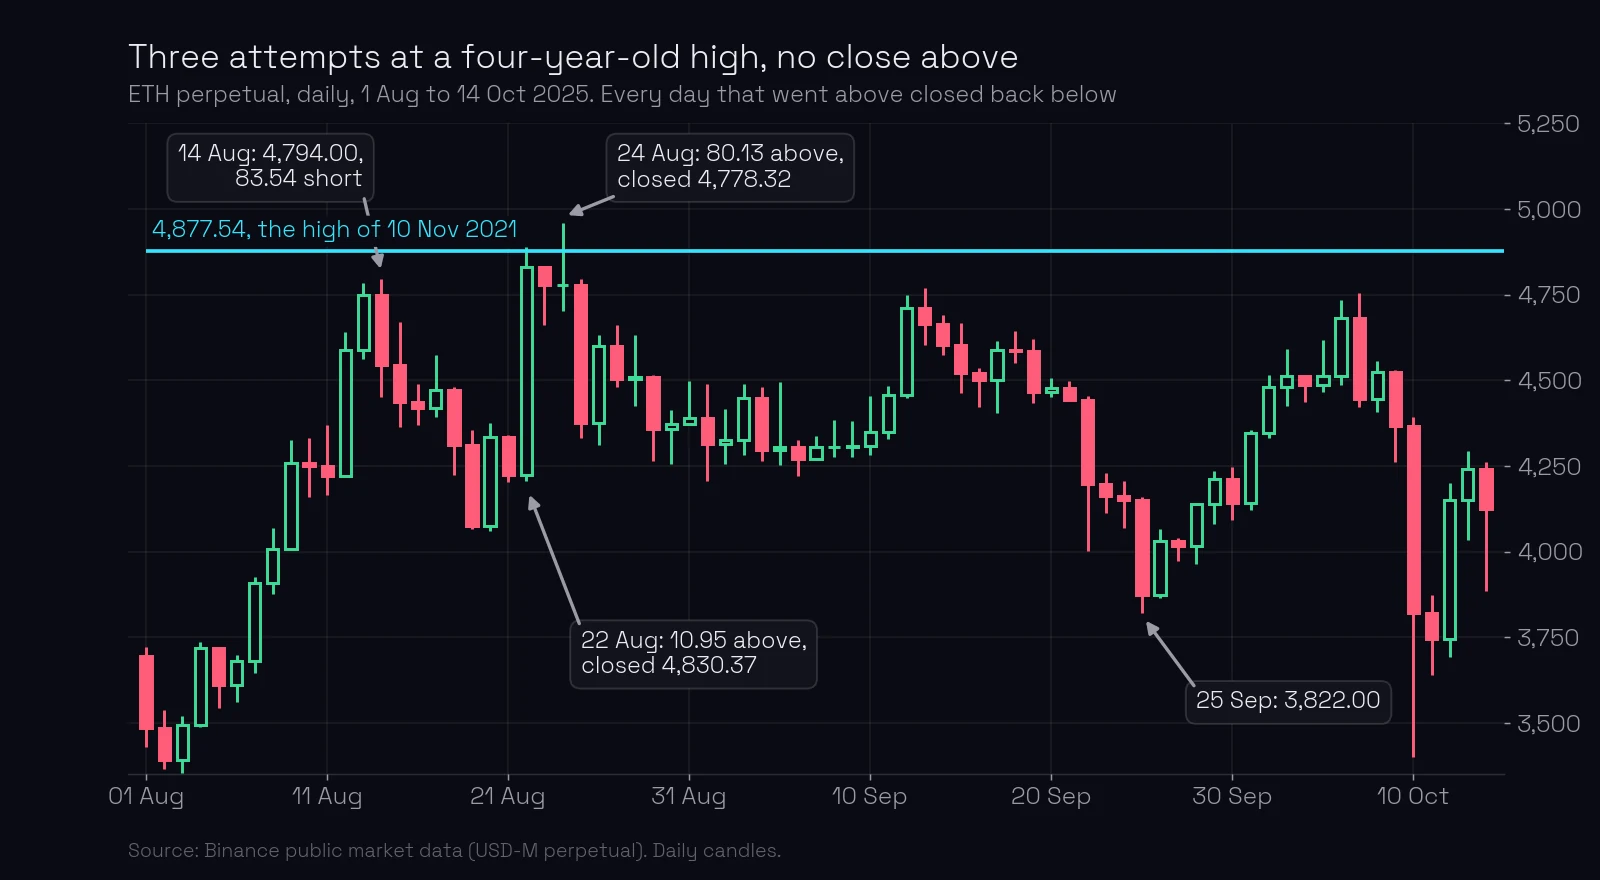
The daily chart shows Ethereum’s three attempts in August 2025:
- 14 August: high 4,794.00, 83.54 short of the level. The day closed at 4,545.26.
- 22 August: high 4,888.49, 10.95 above the level. The day closed back below, at 4,830.37: a false breakout.
- 24 August: high 4,957.67, 80.13 above. Closed back below again, at 4,778.32.
By 25 September price was down at 3,822.00. Through 24 October 2026, the end of the data, Ethereum never closed a day above 4,877.54.
The first attempt does not always fail, and a failed first attempt is not a promise that the level holds. Bitcoin’s all-time high of 2021 shows both.
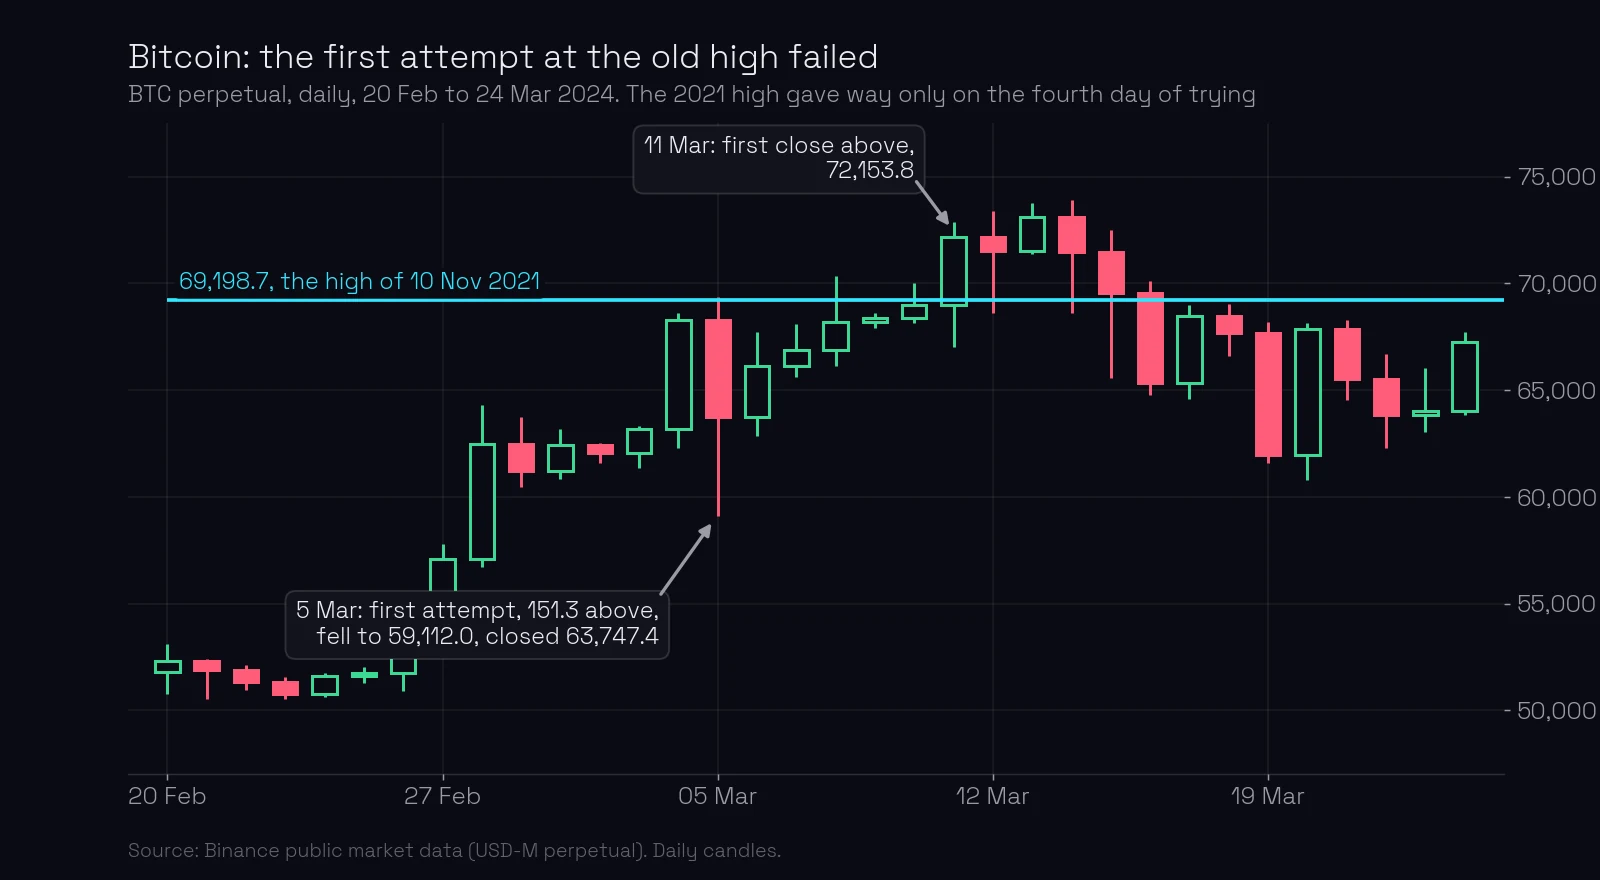
Bitcoin’s contract set its high of 69,198.7 on 10 November 2021, the same day as Ethereum. On 5 March 2024 price came back for the first time, went 151.3 above the level, then fell to 59,112.0 within the same day and closed at 63,747.4. The first attempt failed. Price went above the level again on 8 and 10 March and closed below both times. On 11 March it closed above, at 72,153.8: the fourth day that traded above the level. After that the old high was crossed on 77 days through October 2026, 44 of them in 2024, with closes on both sides: a sawed-through level.
How far back to look
To find a historical level, looking back six months on the daily chart is usually enough (why levels come from the daily chart). If there is no level there, or no trading at all in this price range in six months, move to the weekly or the monthly chart. They show years on one screen.
That is exactly the Ethereum case. In the six months before 9 August 2025 the highest price was 4,070.00. Once price went higher, the daily chart had nothing to the left. The weekly chart did: one week in November 2021, with a high of 4,877.54.
Example: finding Ethereum’s historical level in August 2025
Walk through it as you would have on 13 August 2025, with price at 4,748.37.
- Six months of the daily chart. The highest price since February is 4,070.00. Price is above it: no history at this price.
- Switch to the weekly chart. The last time Ethereum traded here was late 2021. The highest week is 8 November 2021, with a high of 4,877.54 on 10 November.
- Name the event. The all-time high, where a rise of months ended and a fall of 82% began: a trend-change level.
- Check it was not sawed through. From January 2022 to August 2025 price never got above 4,109.99. The level is untouched.
- Size the stop from the ATR. The daily average true range (ATR) before 14 August was 228.70. The course places the stop-loss 10% of the daily ATR beyond the level:
What happened next shows both sides. On 22 August price went 10.95 above the level and the stop at 4,900.41 held. On 24 August price went 80.13 above and took it. The level itself held: both days closed back below. A level tells you where to look. Whether a trade from it works is a separate question, answered by the four pillars.
What most traders miss. An old level is not weaker because it is old. Age does not matter; what happened at the price since it formed does. A four-year-old high that nobody touched since is cleaner than a three-week-old level that price has crossed eight times. Check the history after the forming candle, not the date on it.
Common mistakes
- Stopping at the daily chart when there is no history at the price. Fix: with nothing in six months at this price, open the weekly or monthly chart.
- Treating every old turn as a level. Fix: name the event (a trend change, a false breakout, a limit player) and its forming candle.
- Using an old level that was sawed through. Fix: count the crossings after the level formed; a level crossed back and forth is not usable until it is confirmed again.
- Expecting an old all-time high to break on the first touch. Fix: extremes are rarely broken on the first attempt; plan for a stop short of it or a false breakout.
- Taking a failed first attempt as proof the level will hold. Fix: Bitcoin’s 2021 high broke on the fourth day of trying. Read the situation each time.
Key takeaways
- A historical level is a level price met before: a trend change, a false breakout or a limit player.
- It is good if price did not saw through it after it formed.
- All-time highs and lows are historical levels, and every player sees them.
- Extremes are rarely broken on the first attempt: Ethereum’s 2021 high held three attempts in August 2025.
- Look back six months on the daily chart; with no history at the price, use the weekly or monthly chart.
Lesson test · 7 questions
Check yourself
Can you pass on the first try?
Passing the test completes this lesson. Tests in a module open in order, each after the one before it. A first-try pass scores 100%. Each wrong answer costs 10 points, and every 10 wrong answers lock the test for 30 minutes. Once you pass, your score is final, except that a score of 50 or less can be retaken once.
Tests in a module open in order. Pass the test of the previous lesson first: Level type 4: limit-player levels. You can still read the questions here.
-
What is a historical level?
-
Price has not traded at today’s price in the last six months. Where do you look for a level?
-
Two old highs are near today’s price. One is four years old and price never came back to it. The other is two months old and price closed above and below it on eight days since. Which is the better historical level?
-
Ethereum came back to its 2021 all-time high, 4,877.54, for the first time in August 2025. What did price do?
-
Bitcoin’s first attempt at its 2021 high failed on 5 March 2024. What does that example teach?
-
Price comes back to an old high at 4,877.54 and you plan a short. On that day the daily ATR is 228.70. Where does the stop go by the course rule?
-
Why do all-time highs and lows work as levels?
Free account
Take the test and keep your score
- Your answers are checked and every lesson you pass is marked complete.
- Your scores build into your course score, on any device.
- You come straight back to this question after signing up.
Next: level type 6, IPO and listing levels. Open Ethereum on ChartThread’s levels page and scroll left: when price is far from any recent history, the old levels are the ones that matter.
Terms in this lesson
Related lessons
- Best timeframe for support and resistance: the daily chart
- Level type 1: trend-change levels
- Level type 2: false-breakout levels
- Level type 4: limit-player levels
- Sawed-through levels: when a level is used up coming soon
Educational content, not financial advice. Trading carries a risk of loss.